Fig. 7
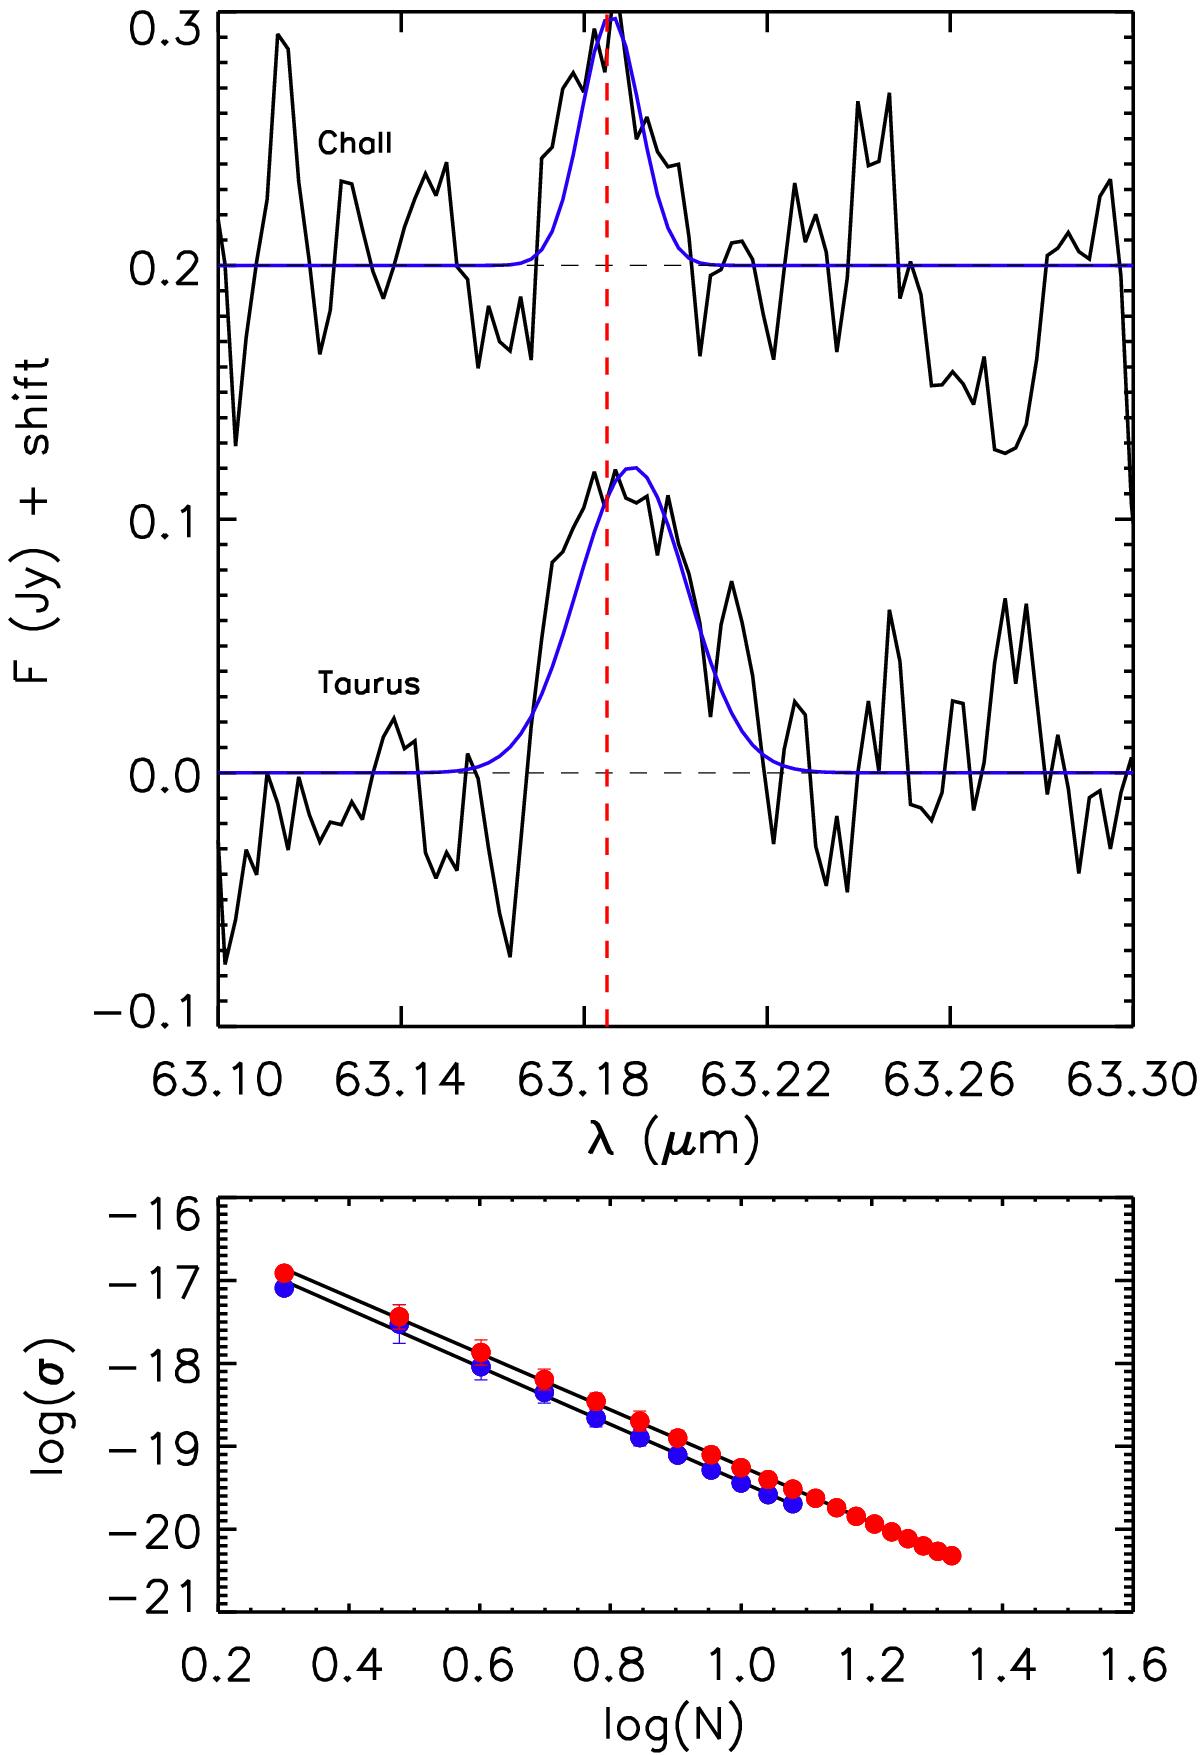
Top: stacking of PACS spectra at 63 μm for objects with no detection in Taurus and Cha II. The blue line shows a Gaussian fit to the emission features. The red dashed vertical line marks the position of the rest frame wavelength for the [OI] ![]() transition at 63.185 μm. Bottom: continuum noise in the resulting stacked spectra for different numbers of co-added spectra in Taurus (in red) and Cha II (in blue). The average noise and noise error are computed as the average and standard deviation of the N realisations of the bootstrap test (see text).
transition at 63.185 μm. Bottom: continuum noise in the resulting stacked spectra for different numbers of co-added spectra in Taurus (in red) and Cha II (in blue). The average noise and noise error are computed as the average and standard deviation of the N realisations of the bootstrap test (see text).
Current usage metrics show cumulative count of Article Views (full-text article views including HTML views, PDF and ePub downloads, according to the available data) and Abstracts Views on Vision4Press platform.
Data correspond to usage on the plateform after 2015. The current usage metrics is available 48-96 hours after online publication and is updated daily on week days.
Initial download of the metrics may take a while.