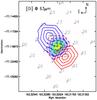
Fig. 6
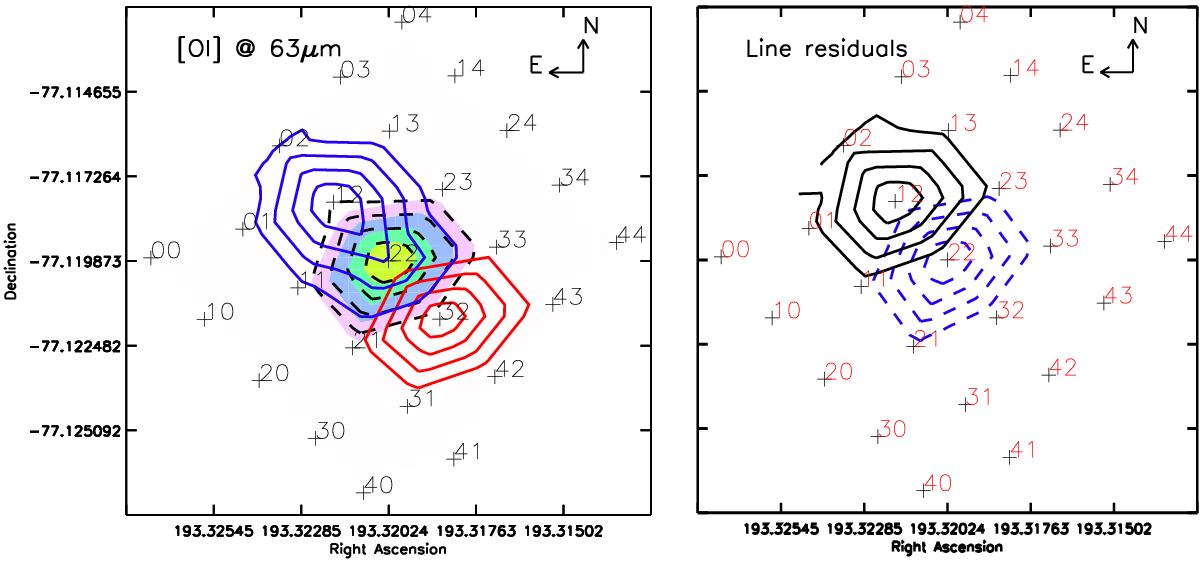
Left: contour plot for line and continuum emission. Black dashed lines are contours for the low-velocity component. The high velocity component is shown in blue for blue-shifted emission and red for red-shifted emission. The continuum distribution is shown with filled, coloured contours. Right: contour plot for line residual emission (see Appendix B in Podio et al. 2012). The blue dashed lines are contours for the continuum emission, while the solid black ones are contours for the line residuals. In both panels, the position of individual spaxels is shown as a net of black crosses labelled according to the spaxel ID. The contour levels shown are at the 80%, 60%, 40% and 20% of the peak level in each case.
Current usage metrics show cumulative count of Article Views (full-text article views including HTML views, PDF and ePub downloads, according to the available data) and Abstracts Views on Vision4Press platform.
Data correspond to usage on the plateform after 2015. The current usage metrics is available 48-96 hours after online publication and is updated daily on week days.
Initial download of the metrics may take a while.