Free Access
Fig. 5
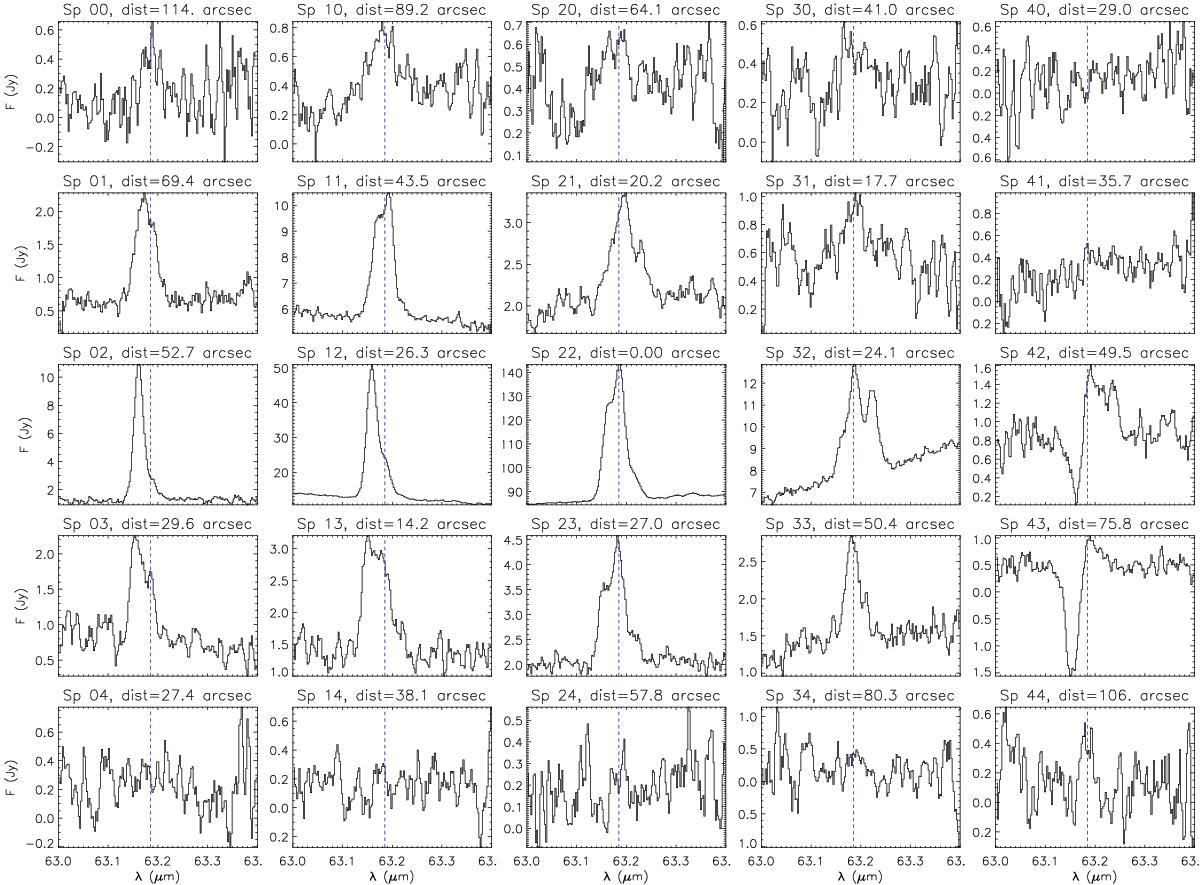
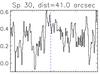
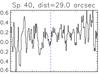
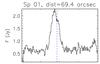
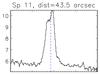
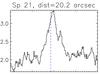
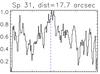
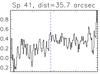
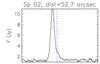
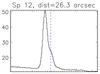
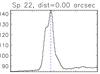
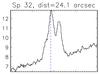
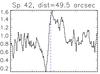
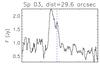
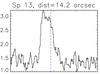
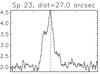
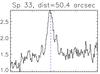
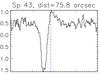
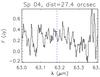
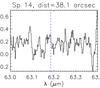
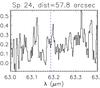
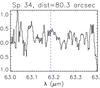
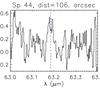
Individual spectra for the 25 spaxels for the DK Cha observation. The blue vertical line marks the position of the rest-frame wavelength of the [OI] ![]() transition. Spaxel number and distance to the central spaxel are given at the top of each plot.
transition. Spaxel number and distance to the central spaxel are given at the top of each plot.
This figure is made of several images, please see below:
Current usage metrics show cumulative count of Article Views (full-text article views including HTML views, PDF and ePub downloads, according to the available data) and Abstracts Views on Vision4Press platform.
Data correspond to usage on the plateform after 2015. The current usage metrics is available 48-96 hours after online publication and is updated daily on week days.
Initial download of the metrics may take a while.