Fig. 2
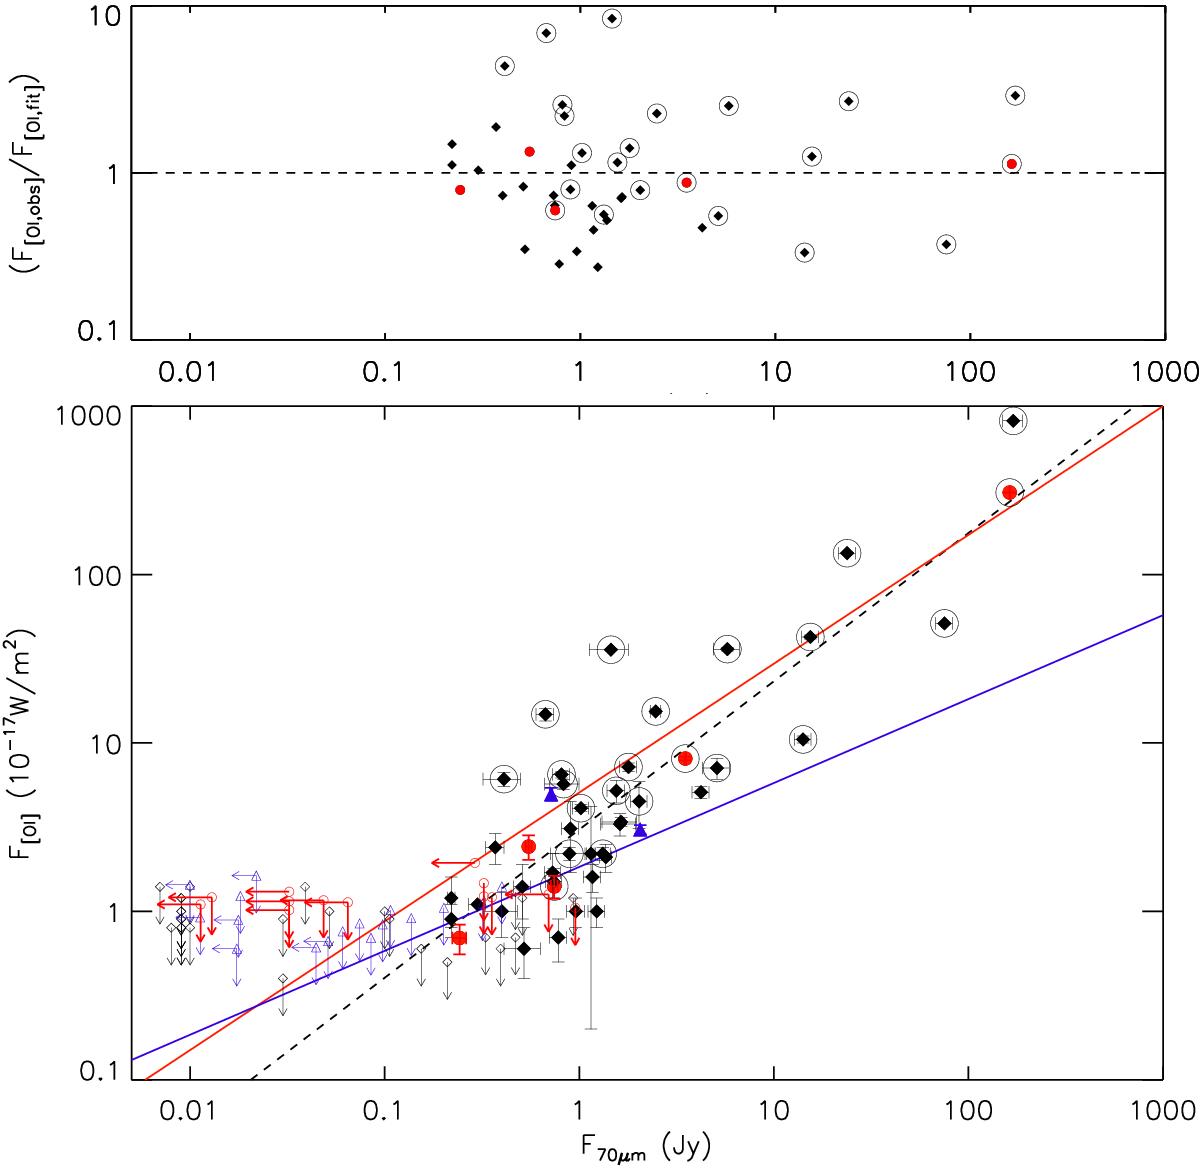
Top: ratio of the observed flux to the flux derived from the fit to all the data. Bottom: [OI] fluxes at 63.18 μm versus the continuum fluxes at 70 μm. Red filled circles are Cha II members with an [OI] detection at 63.18 μm, while red empty circles are upper limits. Black filled diamond are Taurus members with an [OI] detection at 63.18 μm, while black empty diamonds are upper limits. Blue upward filled triangles are Upper Scorpius objects from Mathews et al. (2013), while empty ones are upper limits from the same work. Encircled symbols show the position of known outflow sources in Taurus (in black) and in Cha II (in red). The red line shows a fit to jet sources in Taurus and Cha II, while the blue line shows a fit to non-jet sources in the same associations and the black dashed line shows a fit to all the data. The fluxes for objects in Cha II and Upper Scorpius have been scaled according to the distance to Taurus.
Current usage metrics show cumulative count of Article Views (full-text article views including HTML views, PDF and ePub downloads, according to the available data) and Abstracts Views on Vision4Press platform.
Data correspond to usage on the plateform after 2015. The current usage metrics is available 48-96 hours after online publication and is updated daily on week days.
Initial download of the metrics may take a while.