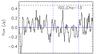
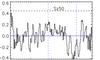
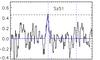
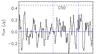
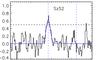
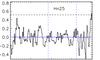
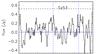
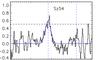
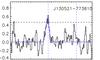
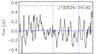
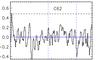
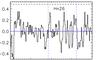
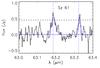
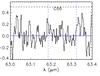
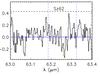
Fig. 1
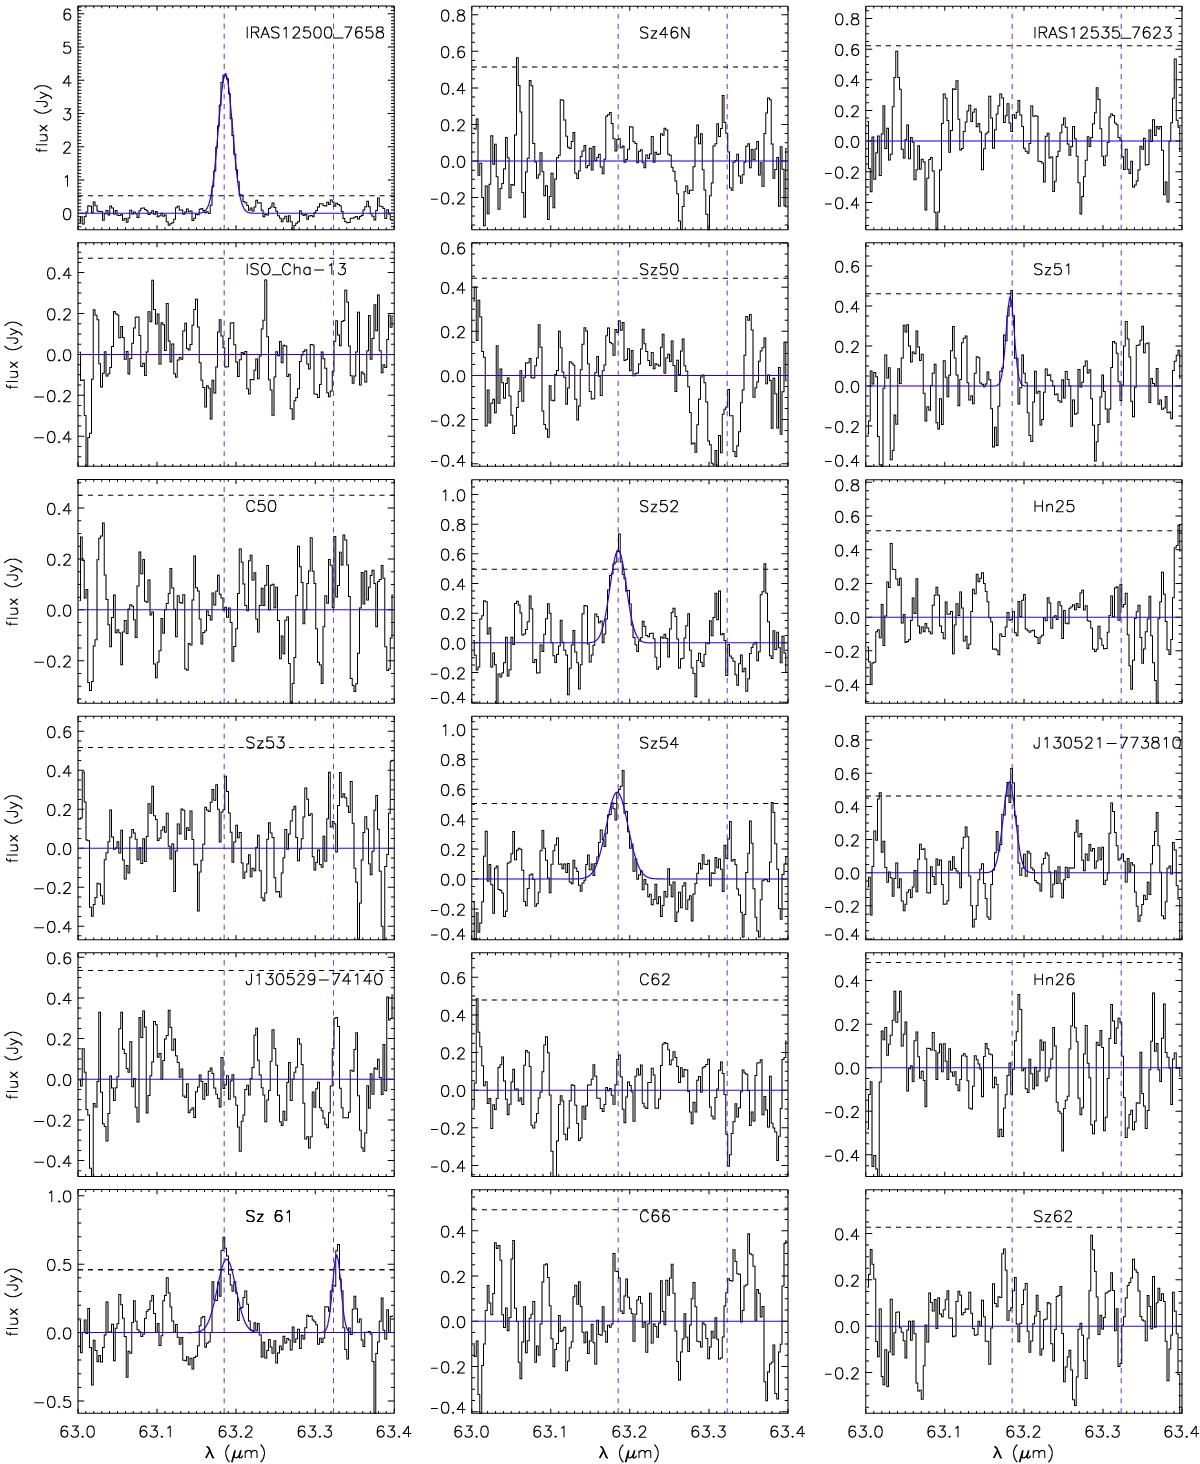
Continuum-subtracted PACS spectra at 63 μm. The horizontal, black dashed line marks the position of the 3σ detection limit for each observed spectrum. The blue solid line shows a Gaussian fit to the observed data. The vertical, blue dashed lines mark the position of the line transitions of [OI] at 63.18 μm and o-H2O at 63.32 μm. We show the spectrum of DK Cha in Fig. 4.
Current usage metrics show cumulative count of Article Views (full-text article views including HTML views, PDF and ePub downloads, according to the available data) and Abstracts Views on Vision4Press platform.
Data correspond to usage on the plateform after 2015. The current usage metrics is available 48-96 hours after online publication and is updated daily on week days.
Initial download of the metrics may take a while.