Fig. 8
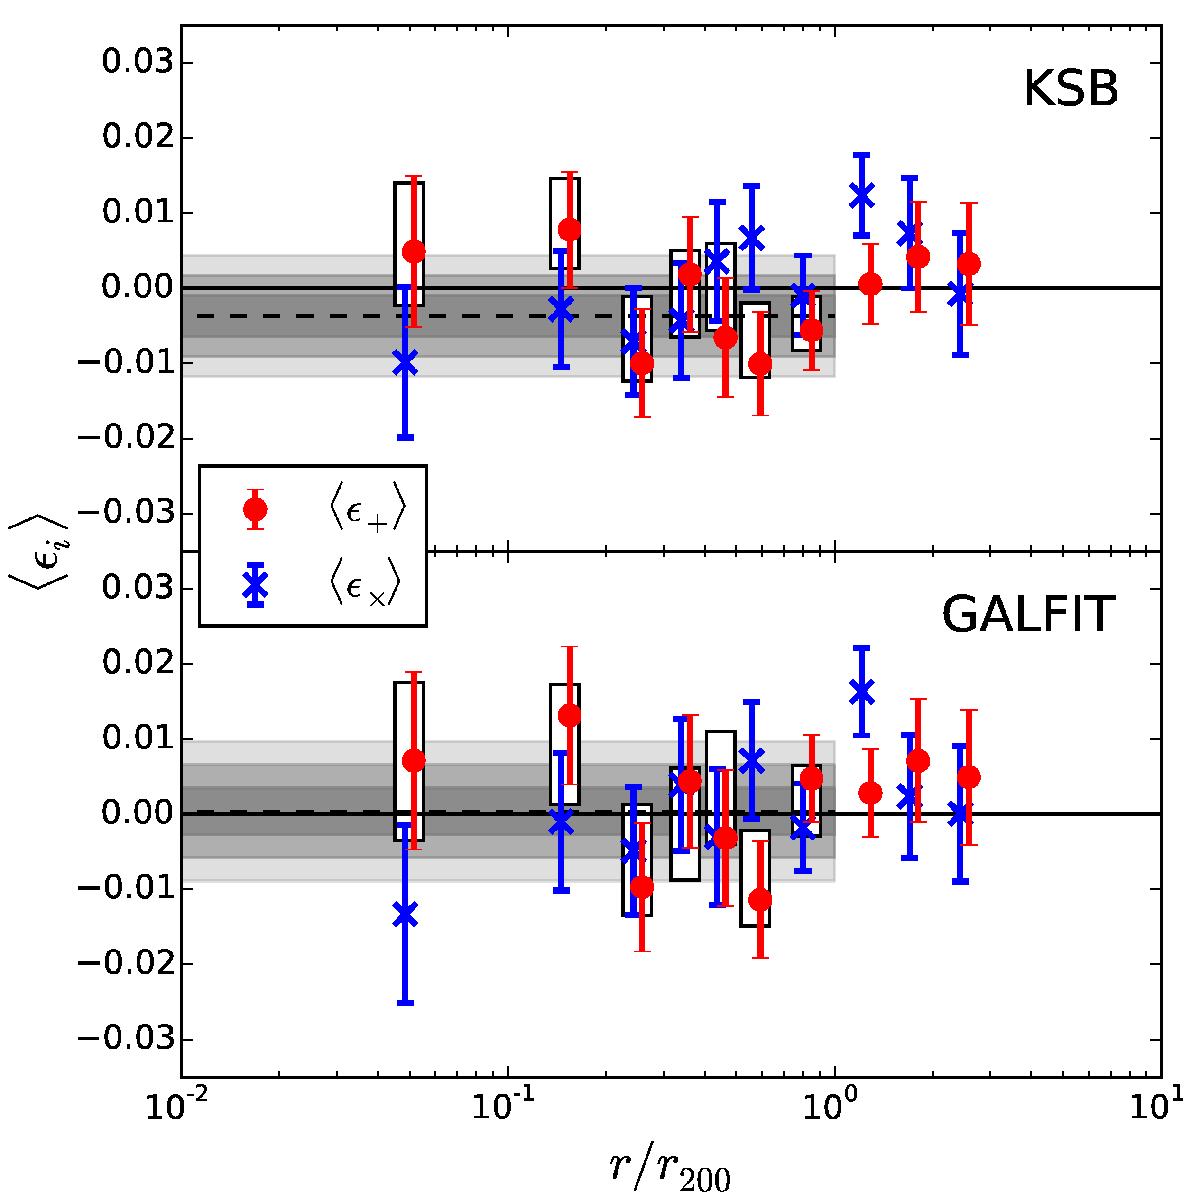
Average alignment of all spectroscopically confirmed members out to 3r200. The top panel shows the results from KSB while the bottom panel shows those from GALFIT. Shaded bands show the 1, 2 and 3σ uncertainties in the overall average and white bars show the 1σ range for ⟨ ϵ+ ⟩ from the enhanced sample including red sequence members. Points are slightly shifted horizontally for clarity.
Current usage metrics show cumulative count of Article Views (full-text article views including HTML views, PDF and ePub downloads, according to the available data) and Abstracts Views on Vision4Press platform.
Data correspond to usage on the plateform after 2015. The current usage metrics is available 48-96 hours after online publication and is updated daily on week days.
Initial download of the metrics may take a while.