Fig. 5
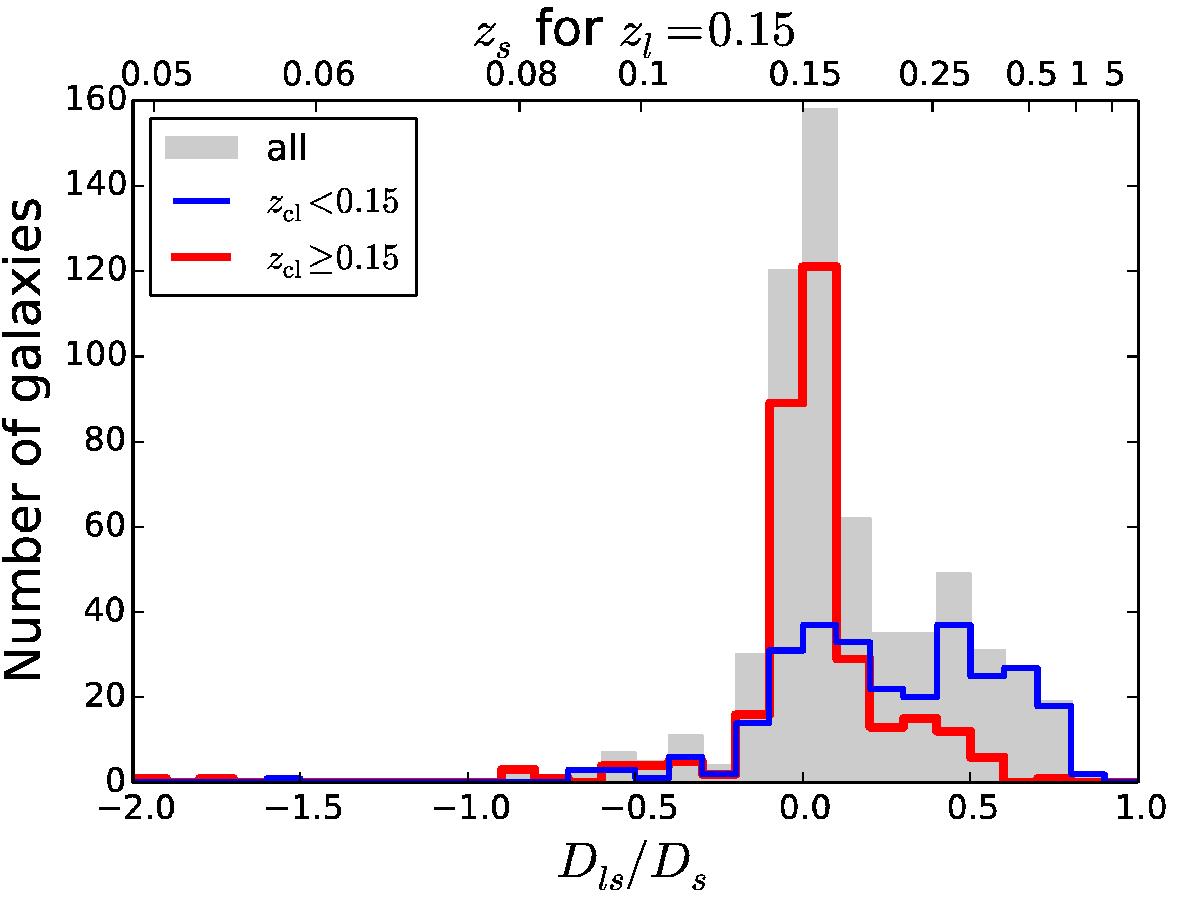
Distribution of the distance ratio, Dls/Ds, for red sequence members that are confirmed to be nonmembers of the clusters from spectroscopic redshifts. The gray filled histogram shows red sequence galaxies from all clusters; the blue and red (empty) histograms show the distributions for clusters at low and high redshift, respectively. For illustration, the top axis shows the source redshift for a cluster at z = 0.15.
Current usage metrics show cumulative count of Article Views (full-text article views including HTML views, PDF and ePub downloads, according to the available data) and Abstracts Views on Vision4Press platform.
Data correspond to usage on the plateform after 2015. The current usage metrics is available 48-96 hours after online publication and is updated daily on week days.
Initial download of the metrics may take a while.