Fig. 13

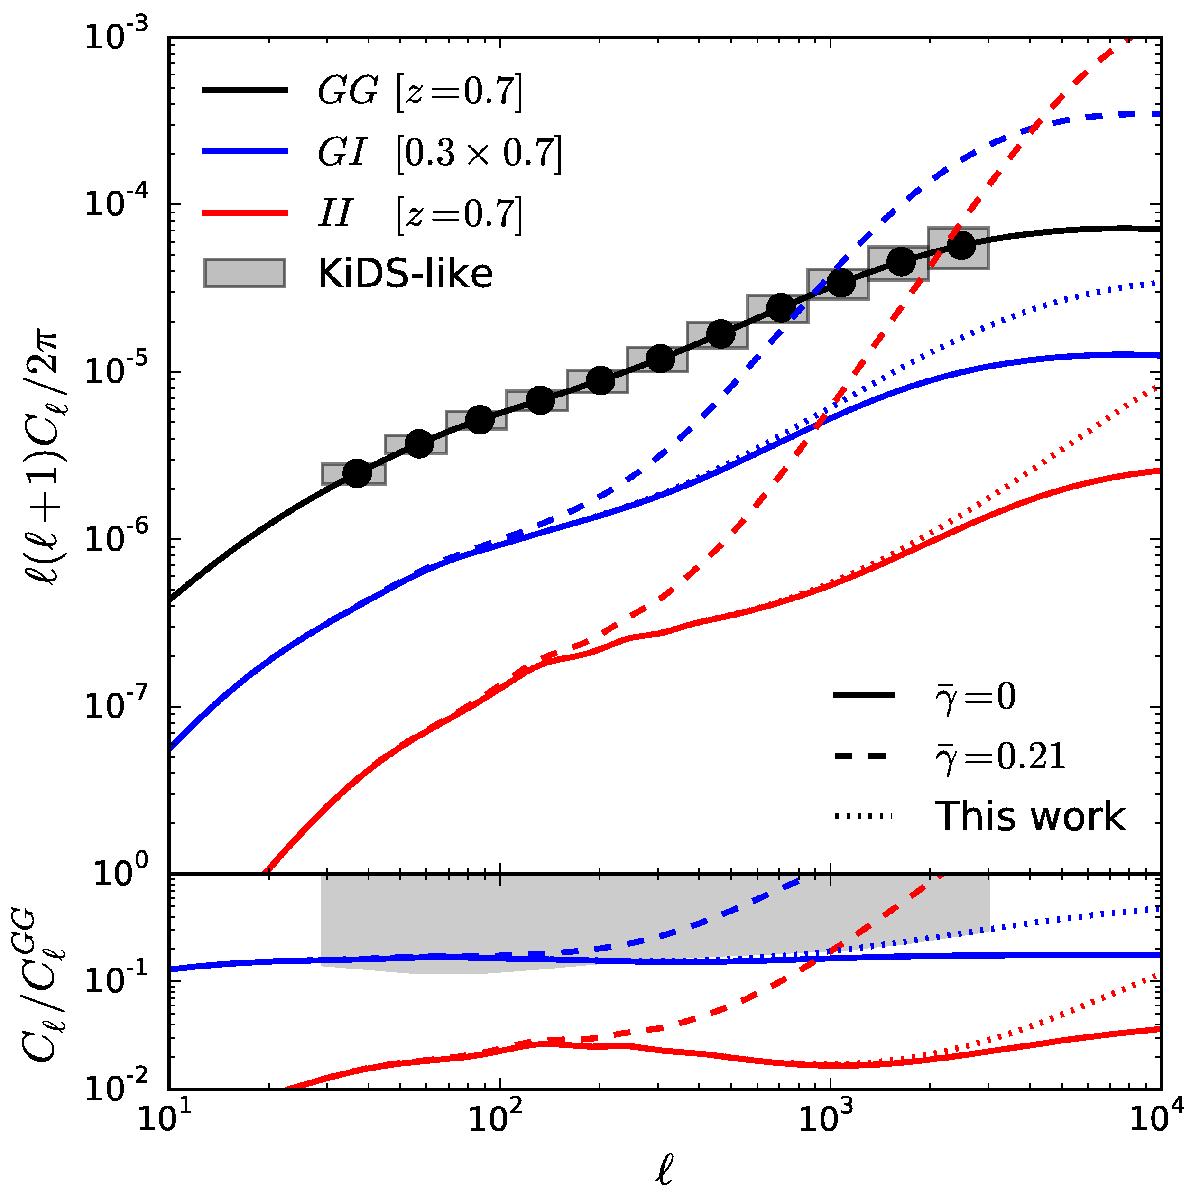
Effect of intrinsic alignments on the angular power spectra. Top
panel: The black line shows the GG power spectrum, while blue and red
lines show the GI and II power spectra, respectively. Solid lines show the linear
alignment model with no small-scale intrinsic alignments, while dashed and dotted
lines model the contribution of satellite galaxies with
![]() as in Schneider & Bridle (2010) and with the
mass-dependent 2σ upper limit on the alignment signal derived
in this work (see Sect. ), respectively. Grey boxes with black circles show the
expected uncertainty levels on a KiDS-like survey covering 1500 sq. deg and with
ngal = 10
arcmin-2. Bottom panel: ratio
between the GI and II power spectra and the GG power spectrum, for each model. The
shaded region shows values above the 1σ uncertainties in the anglar power spectrum
for a KiDS-like survey, where GI and II contributions would dominate over
statistical uncertainties.
as in Schneider & Bridle (2010) and with the
mass-dependent 2σ upper limit on the alignment signal derived
in this work (see Sect. ), respectively. Grey boxes with black circles show the
expected uncertainty levels on a KiDS-like survey covering 1500 sq. deg and with
ngal = 10
arcmin-2. Bottom panel: ratio
between the GI and II power spectra and the GG power spectrum, for each model. The
shaded region shows values above the 1σ uncertainties in the anglar power spectrum
for a KiDS-like survey, where GI and II contributions would dominate over
statistical uncertainties.
Current usage metrics show cumulative count of Article Views (full-text article views including HTML views, PDF and ePub downloads, according to the available data) and Abstracts Views on Vision4Press platform.
Data correspond to usage on the plateform after 2015. The current usage metrics is available 48-96 hours after online publication and is updated daily on week days.
Initial download of the metrics may take a while.


