Fig. 1
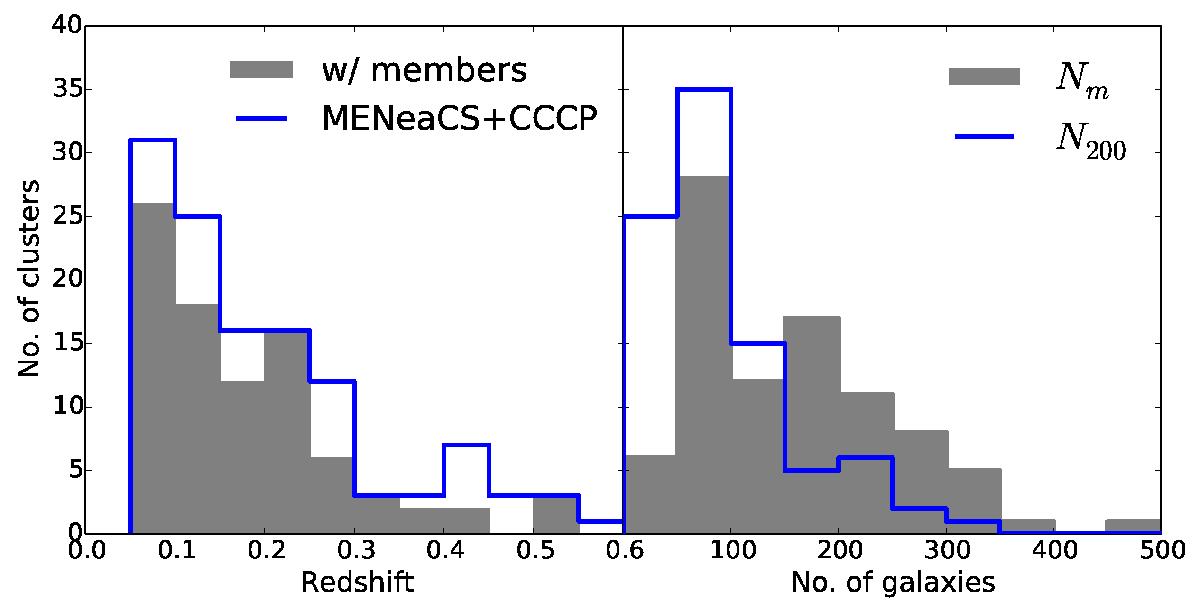
Left: redshift distributions of all MENeaCS+CCCP clusters (blue histogram) and clusters used in this study (gray filled histogram). Right: distributions of number of spectroscopic members, Nm (gray filled histogram), and number of spectroscopic members within r200, N200 (blue histogram). Abell 2142, with Nm = 1052 and N200 = 731, is not shown.
Current usage metrics show cumulative count of Article Views (full-text article views including HTML views, PDF and ePub downloads, according to the available data) and Abstracts Views on Vision4Press platform.
Data correspond to usage on the plateform after 2015. The current usage metrics is available 48-96 hours after online publication and is updated daily on week days.
Initial download of the metrics may take a while.