Fig. 7
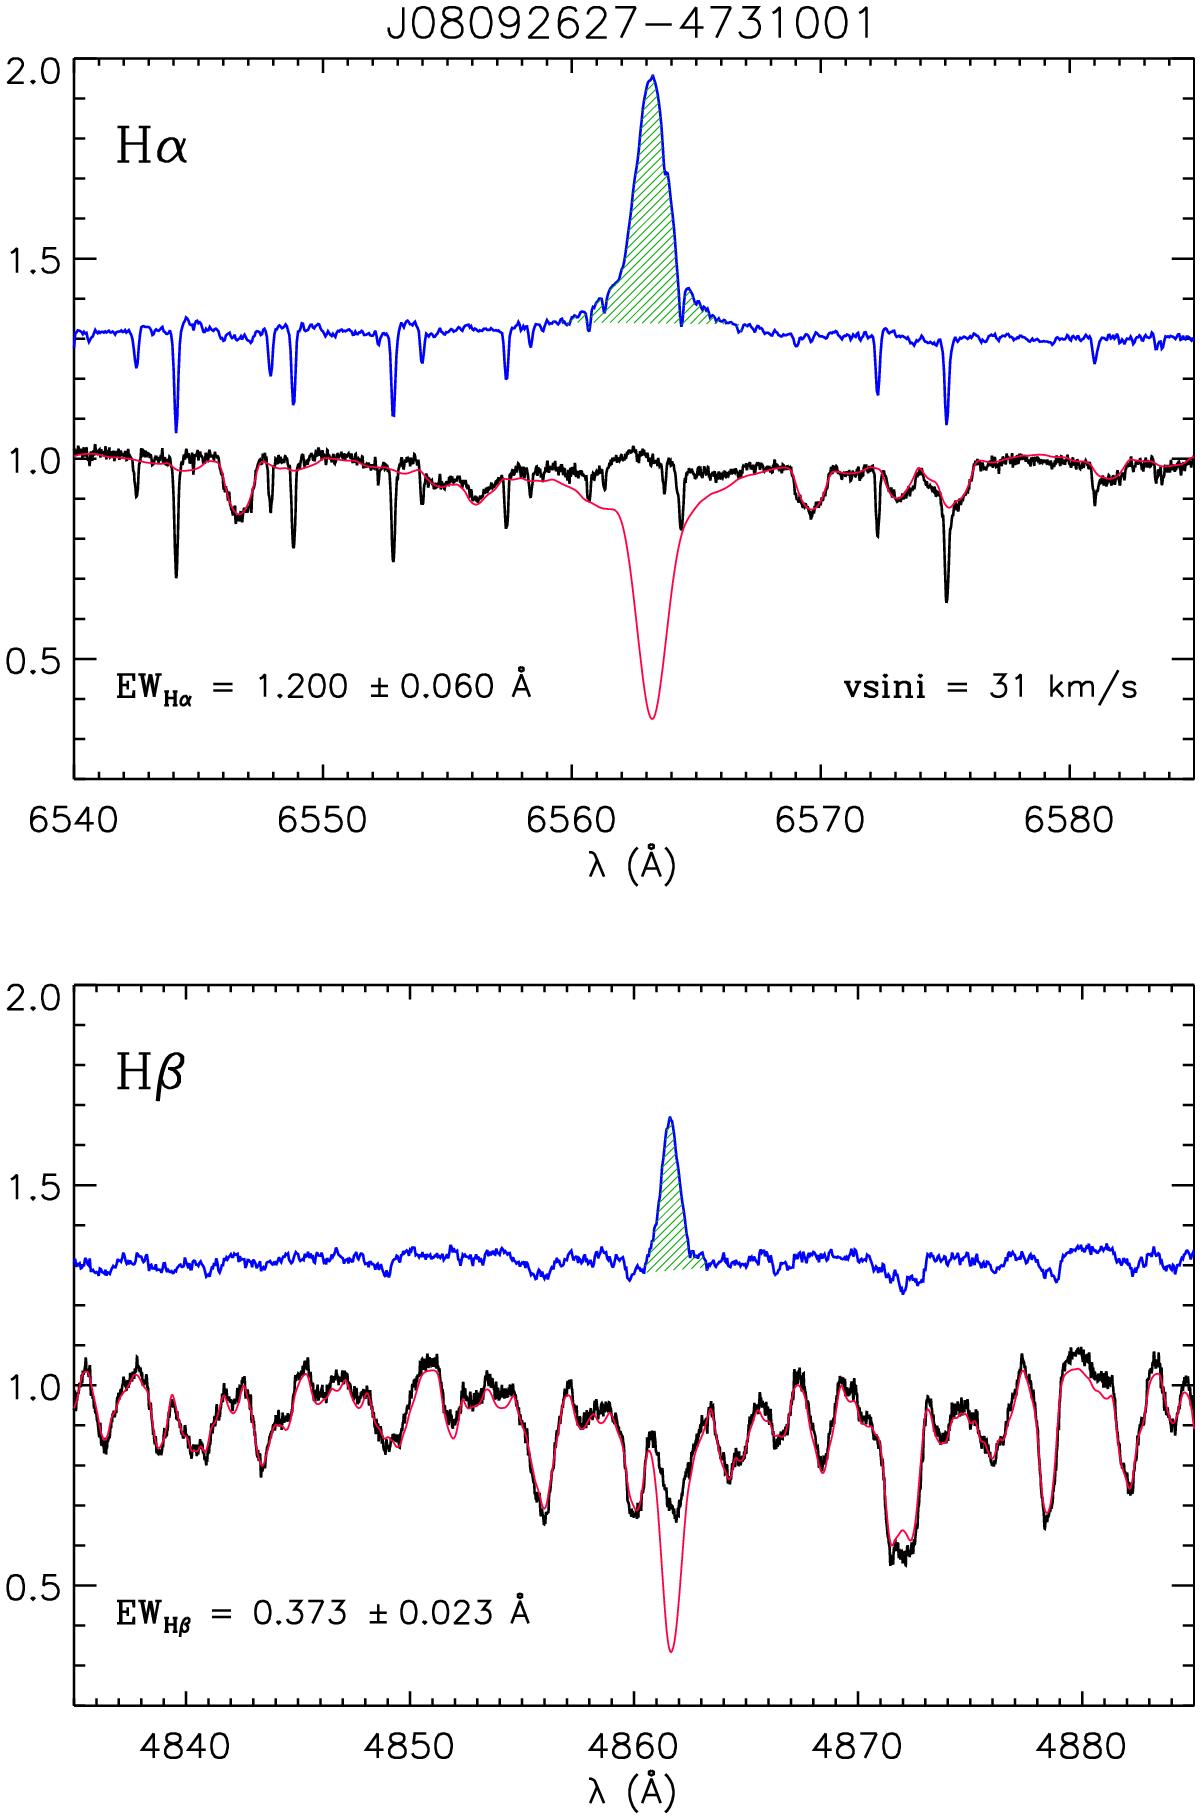
Example of the spectral subtraction method with UVES spectra in the Hα (upper panel) and Hβ (lower panel) regions for an active star in γ Vel. The target spectrum is represented by a solid black line, while the best-fitting reference spectrum of a low-activity star artificially broadened at the vsini of the target is overplotted with a thin red line. In both panels, the difference spectrum (blue line) is displayed as shifted upward by 1.3 for clarity. The residual Hα and Hβ profiles integrated over wavelength (hatched green areas) provide the net equivalent widths (EWHα and EWHβ). The narrow absorption features visible in the upper panel are telluric water-vapor lines.
Current usage metrics show cumulative count of Article Views (full-text article views including HTML views, PDF and ePub downloads, according to the available data) and Abstracts Views on Vision4Press platform.
Data correspond to usage on the plateform after 2015. The current usage metrics is available 48-96 hours after online publication and is updated daily on week days.
Initial download of the metrics may take a while.