Fig. 6
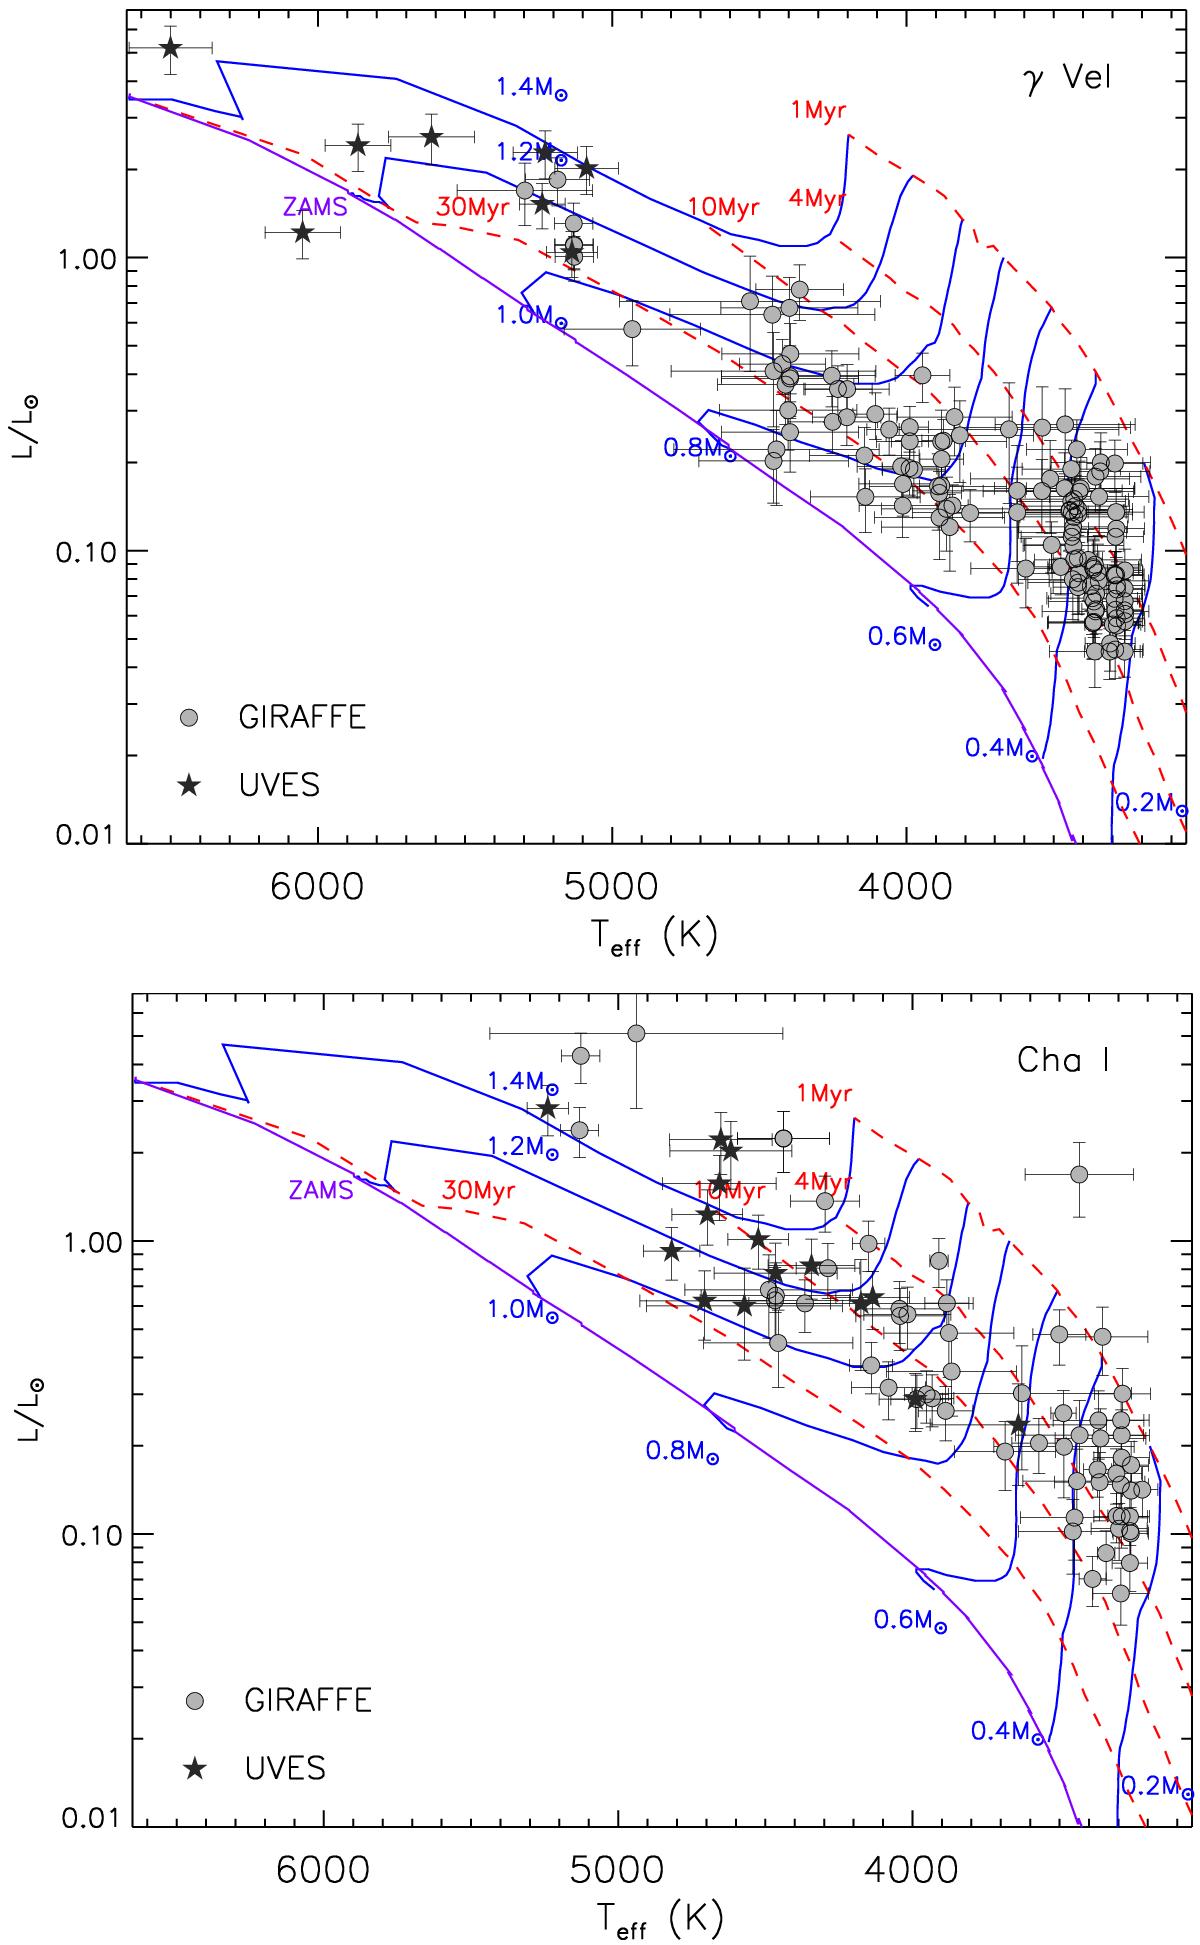
HR diagram of γ Vel (upper panel) and Cha I (lower panel) members for both UVES and GIRAFFE data. The evolutionary tracks of Baraffe et al. (1998) are shown by solid lines with the labels representing their masses. Similarly, the isochrones (from 1 to 30 Myr) by the same authors are shown with dashed lines. The ZAMS position is also represented by a solid line.
Current usage metrics show cumulative count of Article Views (full-text article views including HTML views, PDF and ePub downloads, according to the available data) and Abstracts Views on Vision4Press platform.
Data correspond to usage on the plateform after 2015. The current usage metrics is available 48-96 hours after online publication and is updated daily on week days.
Initial download of the metrics may take a while.