Fig. 15
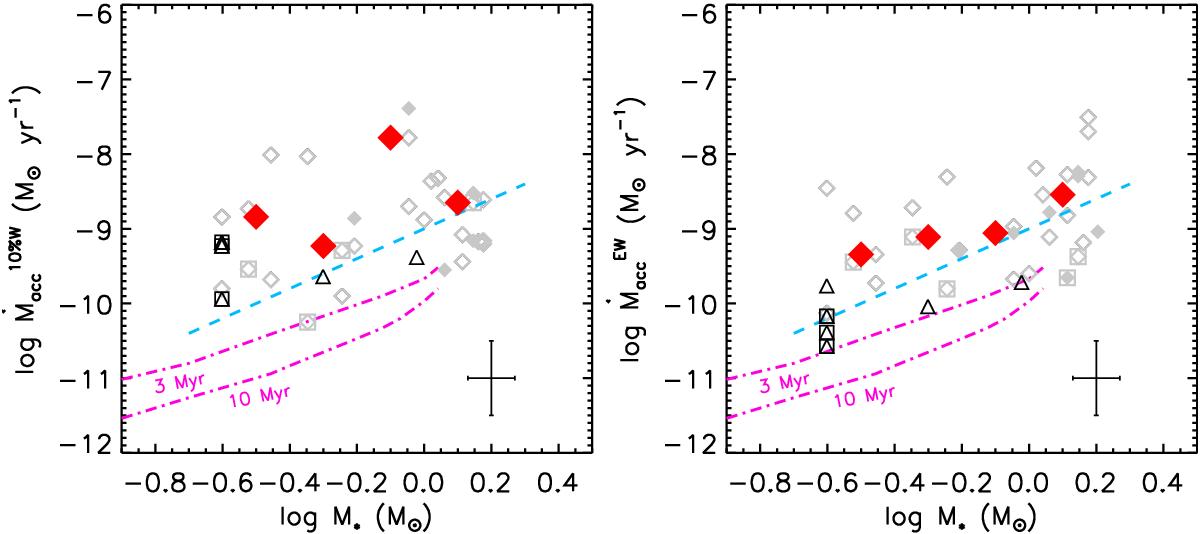
Mass accretion rate from 10%WHα (left panel) and EWHα (right panel) versus stellar mass. Diamonds and triangles represent Cha I and γ Vel stars, where filled and empty symbols refer to UVES and GIRAFFE data, respectively. Squares mark the position of the possible accretors. Big red diamonds represent the median values of Ṁacc for stellar masses of Cha I members binned at 0.2 M⊙, where both confirmed and possible accretors were considered. The dashed line represents the ![]() relation, while the “noise boundaries” at 3 Myr and 10 Myr due to chromospheric activity are overplotted by dash-dotted lines (Manara et al. 2013). Mean error bars are overplotted in the right corners of both panels.
relation, while the “noise boundaries” at 3 Myr and 10 Myr due to chromospheric activity are overplotted by dash-dotted lines (Manara et al. 2013). Mean error bars are overplotted in the right corners of both panels.
Current usage metrics show cumulative count of Article Views (full-text article views including HTML views, PDF and ePub downloads, according to the available data) and Abstracts Views on Vision4Press platform.
Data correspond to usage on the plateform after 2015. The current usage metrics is available 48-96 hours after online publication and is updated daily on week days.
Initial download of the metrics may take a while.