Free Access
Fig. 5
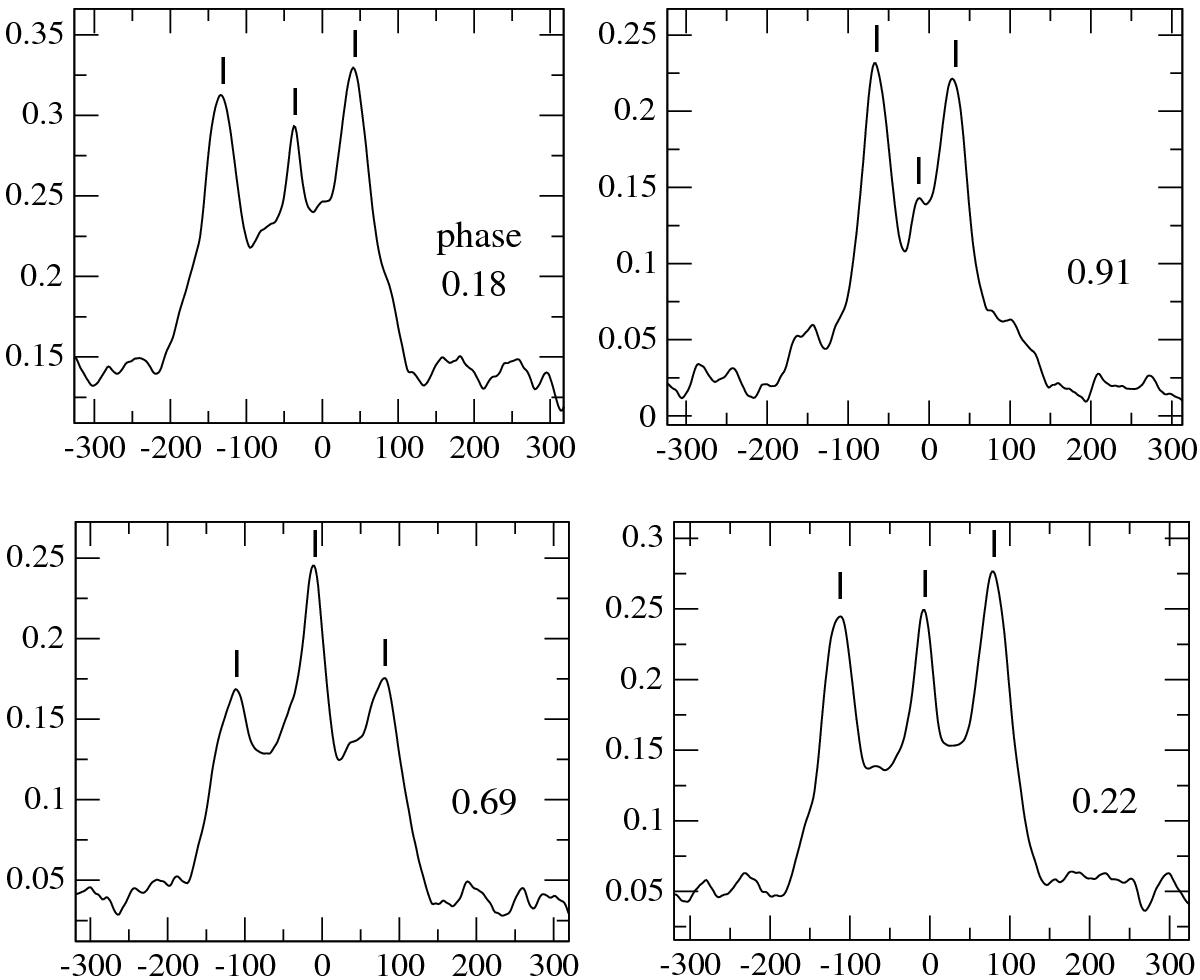
Four examples of cross-correlation function (PST1 spectra). The three peaks are marked, the central one is connected with the main visual component A. Outer peaks correspond to component B, the eclipsing pair. Horizontal axis shows the observed velocity and vertical axis the correlation coefficient.
Current usage metrics show cumulative count of Article Views (full-text article views including HTML views, PDF and ePub downloads, according to the available data) and Abstracts Views on Vision4Press platform.
Data correspond to usage on the plateform after 2015. The current usage metrics is available 48-96 hours after online publication and is updated daily on week days.
Initial download of the metrics may take a while.