Fig. 16
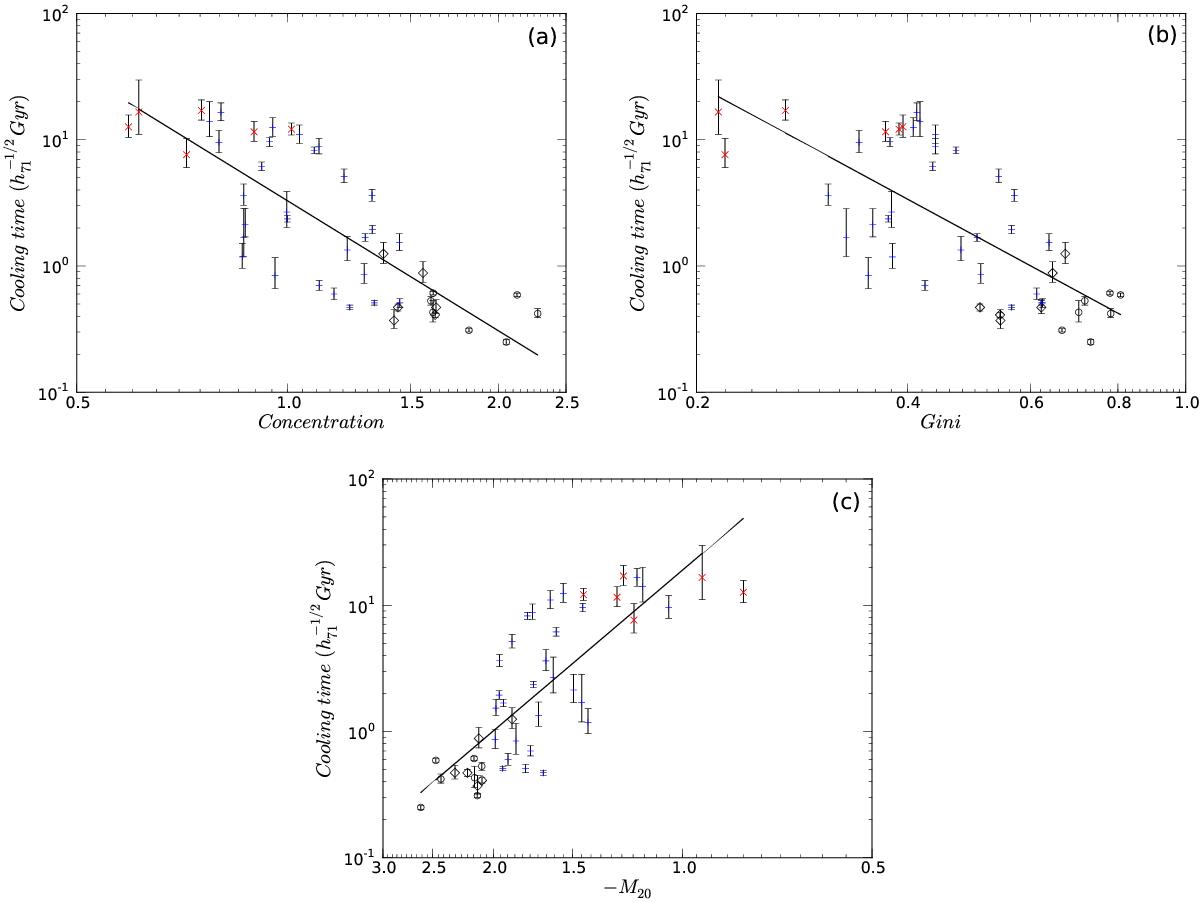
Panel a): concentration (C5080) parameter negatively correlated with cooling time for fixed radii. Panel b): Gini coefficient negatively correlated with cooling time. Panel c): M20 correlated with cooling time. ° = strong relaxed clusters; ◇ = relaxed clusters; + = non-relaxed clusters; and × = strong non-relaxed clusters. We used the power law fitting to show the linear correlation.
Current usage metrics show cumulative count of Article Views (full-text article views including HTML views, PDF and ePub downloads, according to the available data) and Abstracts Views on Vision4Press platform.
Data correspond to usage on the plateform after 2015. The current usage metrics is available 48-96 hours after online publication and is updated daily on week days.
Initial download of the metrics may take a while.