Fig. 14
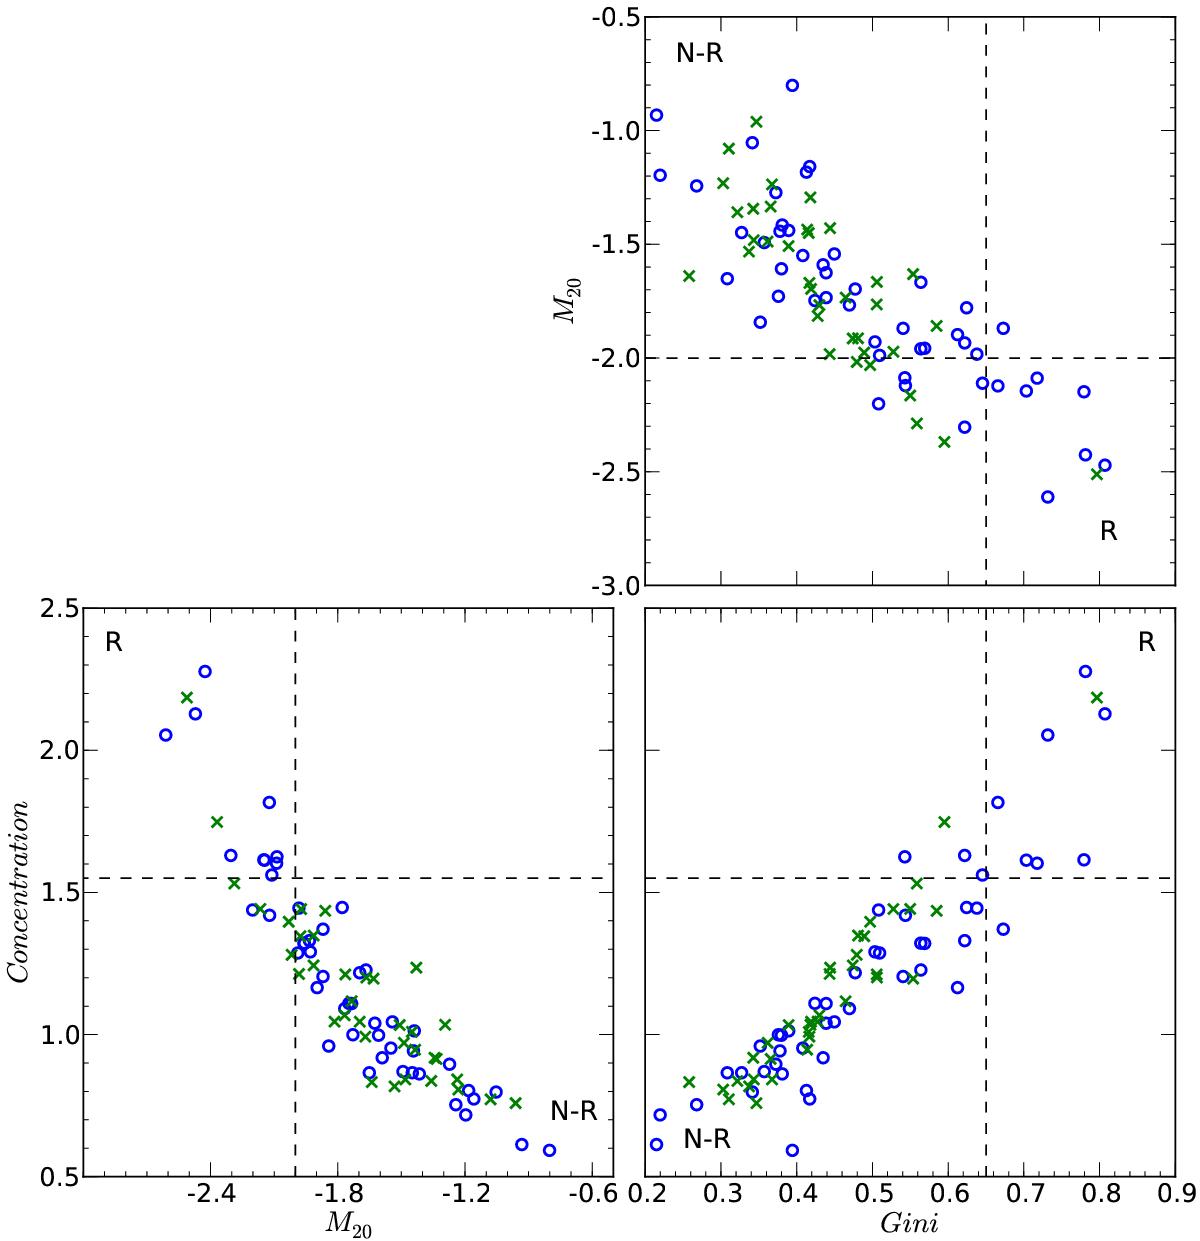
Three parameters plotted in the parameter-parameter planes to show cluster evolution with redshift. Here we plotted C5080 as the concentration parameter. ° = low-z cluster (0.02–0.3); × = high-z cluster (0.3–0.9). The dashed lines represent the boundaries between relaxed and non-relaxed clusters. Boundary values for Gini = 0.65, M20 = −2.0, and concentration = 1.55. R indicates relaxed clusters and N-R indicates non-relaxed clusters.
Current usage metrics show cumulative count of Article Views (full-text article views including HTML views, PDF and ePub downloads, according to the available data) and Abstracts Views on Vision4Press platform.
Data correspond to usage on the plateform after 2015. The current usage metrics is available 48-96 hours after online publication and is updated daily on week days.
Initial download of the metrics may take a while.