Fig. 4
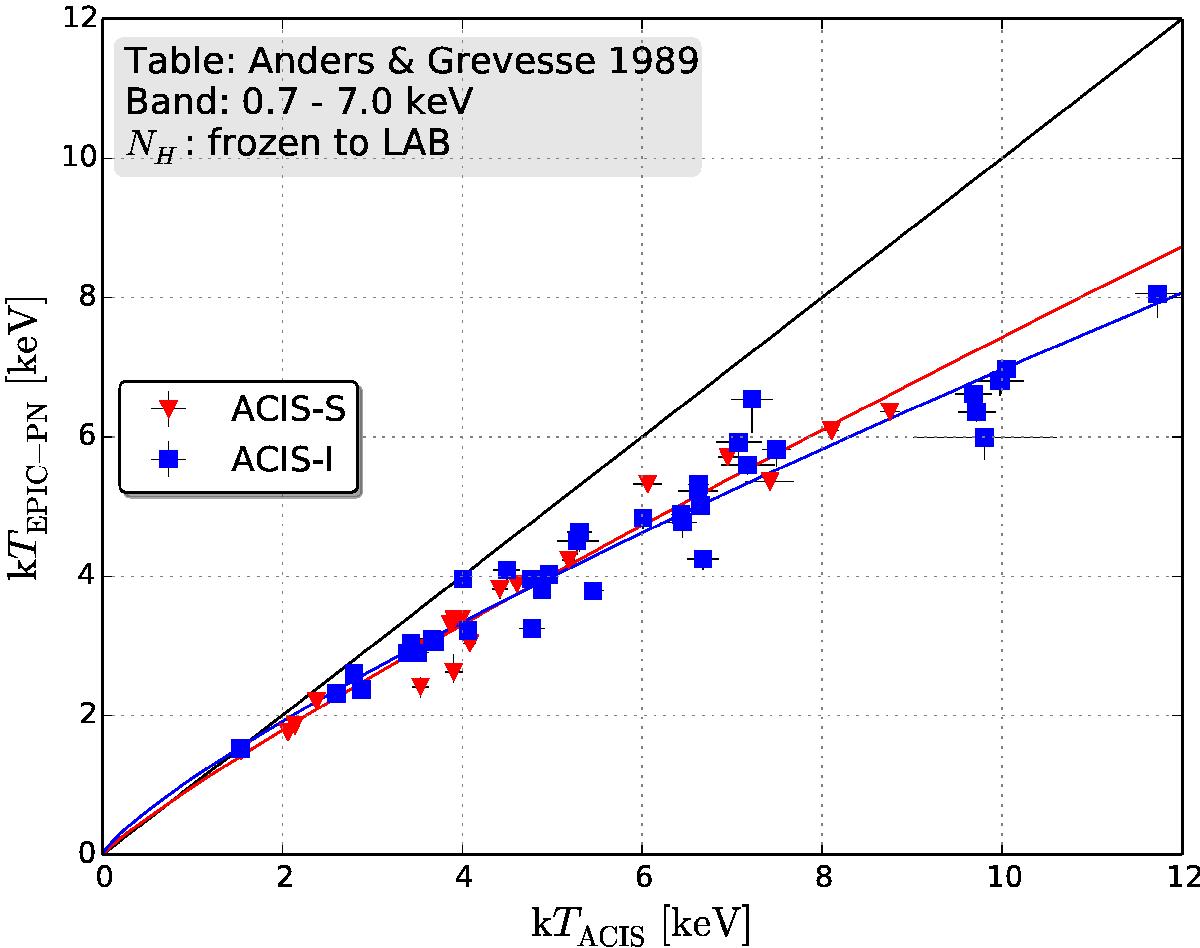
Comparison of EPIC-PN full energy band temperatures with those obtained with ACIS-I (blue squares) and ACIS-S (red triangles). The NH is frozen to the radio value of the LAB survey. For a comparison of the resulting best-fit parameters see also Fig. B.5 and Table 2. The red and blue lines show the powerlaw best-fit function (Eq. (3)) to the ACIS-S and ACIS-I subsamples, respectively.
Current usage metrics show cumulative count of Article Views (full-text article views including HTML views, PDF and ePub downloads, according to the available data) and Abstracts Views on Vision4Press platform.
Data correspond to usage on the plateform after 2015. The current usage metrics is available 48-96 hours after online publication and is updated daily on week days.
Initial download of the metrics may take a while.