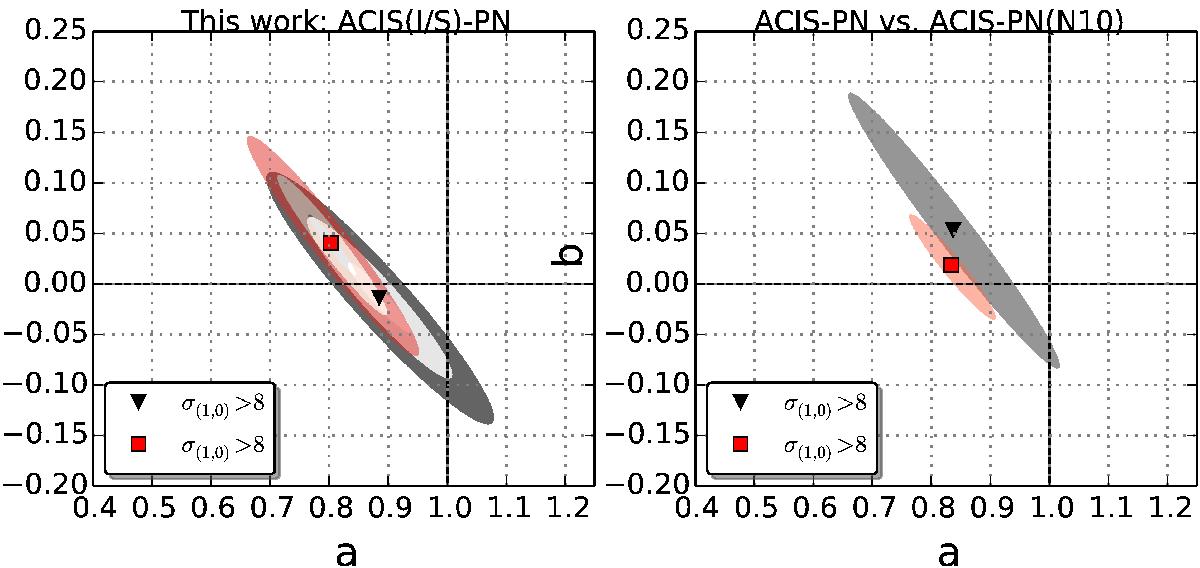
Fig. B.5

Left: fit parameter degeneracy for the 1, 3, and 5σ levels of ACIS – PN for the (0.7−7) keV energy band. ACIS-I (red square) and ACIS-S (black triangle) HIFLUGCS subsamples are shown versus the PN data (for all ACIS data combined, see Fig. B.4, top left panel, gray ellipse). Equality of temperatures for two instruments is given for a = 1 and b = 0. The deviation in σ from equality is given in the legend. Right: as in the left panel but only 3σ levels (gray and red ellipses) of ACIS – PN with temperatures taken from N10 (0.5−7 keV energy band, black triangle) and complete ACIS – PN of this work (0.7−7 keV energy band, red square).
Current usage metrics show cumulative count of Article Views (full-text article views including HTML views, PDF and ePub downloads, according to the available data) and Abstracts Views on Vision4Press platform.
Data correspond to usage on the plateform after 2015. The current usage metrics is available 48-96 hours after online publication and is updated daily on week days.
Initial download of the metrics may take a while.


