Free Access
Fig. 13
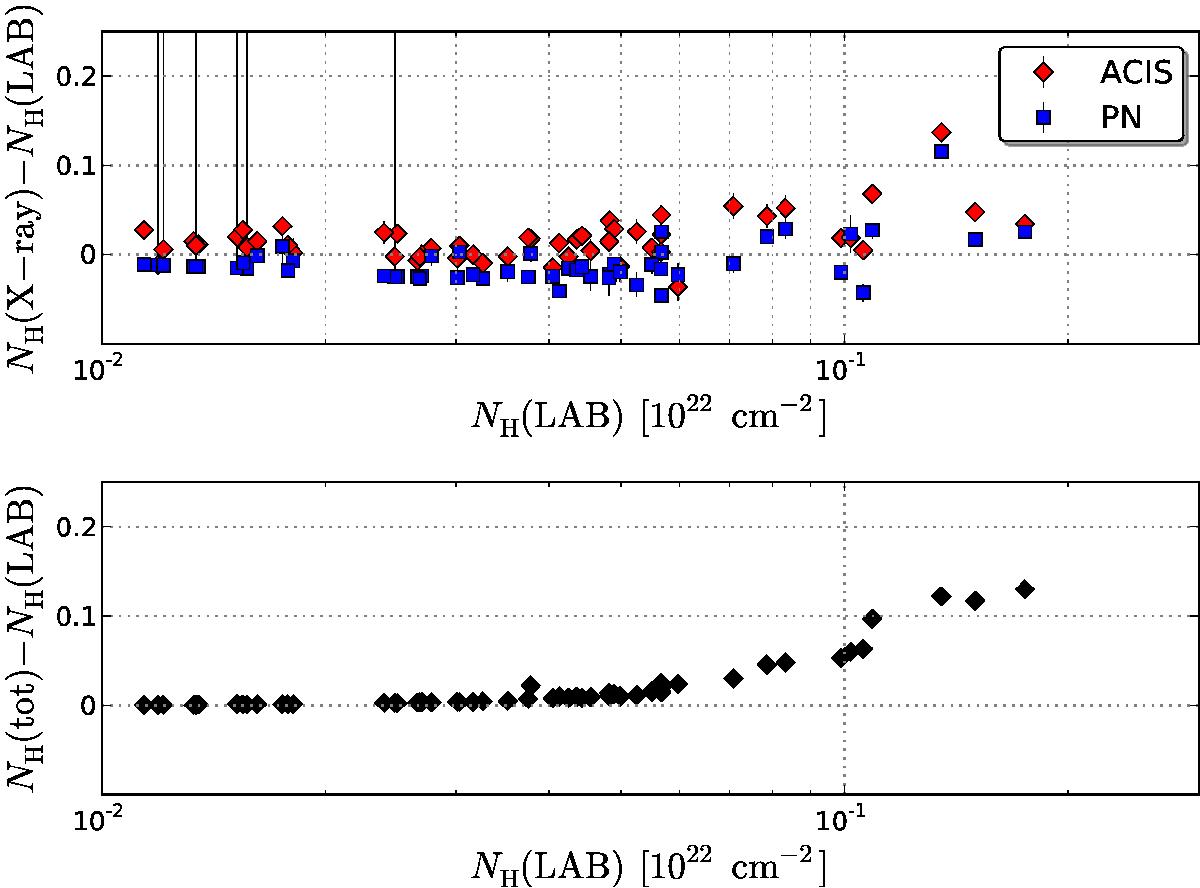
Top: determined NH values for Chandra (red diamonds) and EPIC-PN (blue squares). Bottom: comparison of the NH,tot and the LAB hydrogen column density values for the HIFLUGCS clusters. The y-axis is in units of 1022 cm-2, and the abundance table used is AnGr.
Current usage metrics show cumulative count of Article Views (full-text article views including HTML views, PDF and ePub downloads, according to the available data) and Abstracts Views on Vision4Press platform.
Data correspond to usage on the plateform after 2015. The current usage metrics is available 48-96 hours after online publication and is updated daily on week days.
Initial download of the metrics may take a while.