Fig. 12
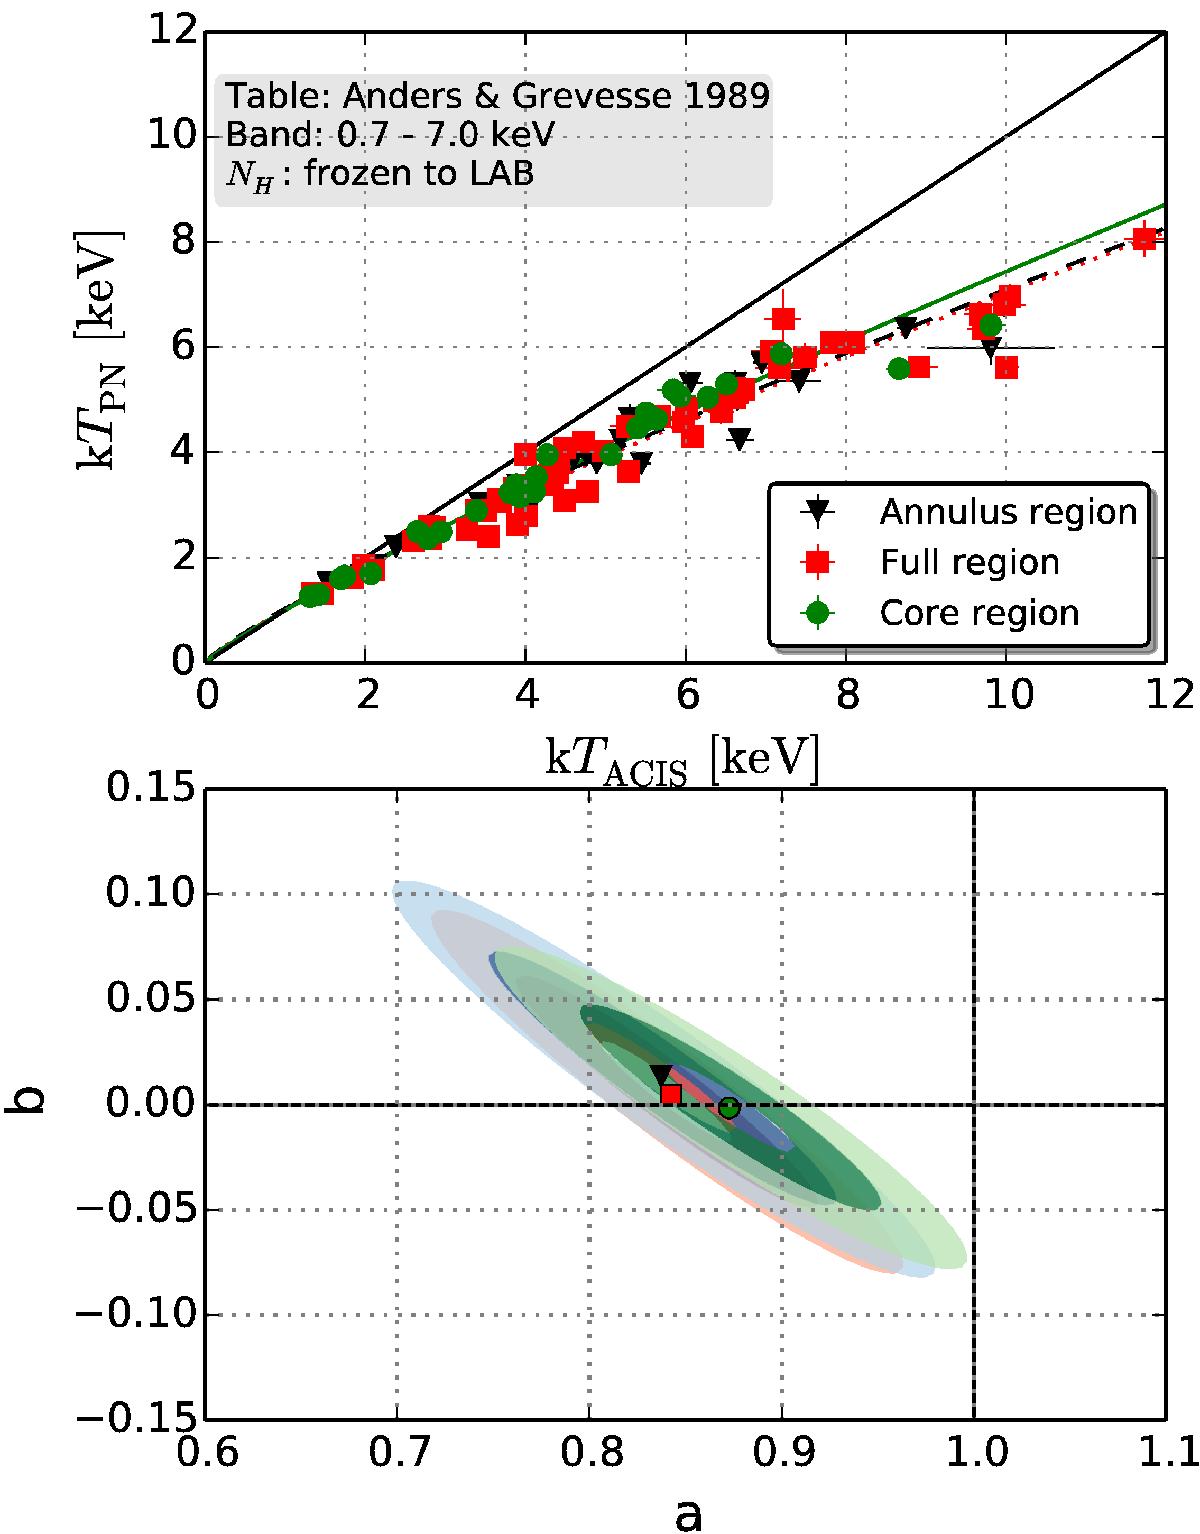
Top: XMM-Newton/EPIC-PN versus Chandra/ACIS temperatures in the full energy band. The different colors correspond to the 3 different regions where the spectra could be extracted: The full 3.5′ circle (red squares), the cool core region (green circles), and the annulus between the two (black triangles). In the cool core region, the strongest influence of multitemperature plasma is expected. Bottom: degeneracy between the parameters a and b for the three cases shown above. The shaded regions correspond to 1σ, 3σ, and 5σ confidence levels.
Current usage metrics show cumulative count of Article Views (full-text article views including HTML views, PDF and ePub downloads, according to the available data) and Abstracts Views on Vision4Press platform.
Data correspond to usage on the plateform after 2015. The current usage metrics is available 48-96 hours after online publication and is updated daily on week days.
Initial download of the metrics may take a while.