Fig. 11
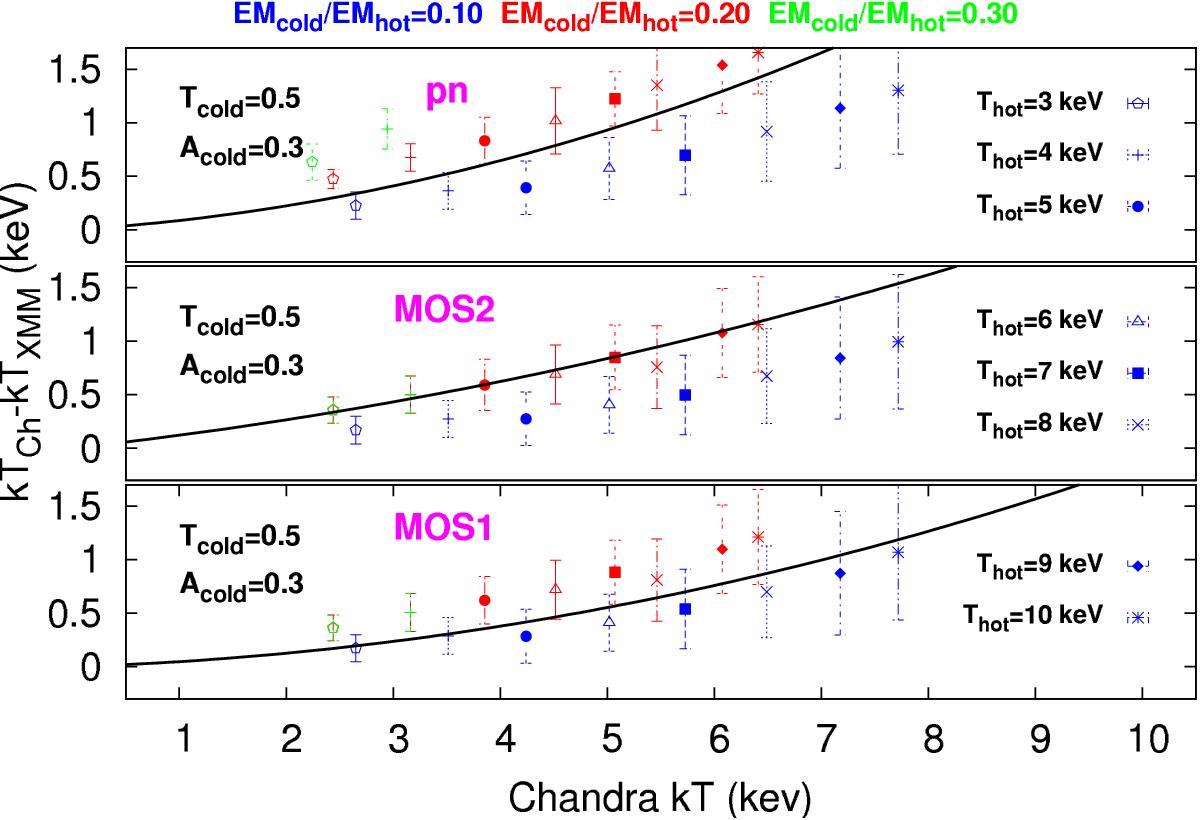
Difference between Chandra and XMM-Newton single-temperature fits to two-temperature component mock spectra vs. the Chandra best-fit temperature. The three colors correspond to different emission measure ratios (EMR) of the cold and hot components, the symbols represent 8 different temperatures of the hot component, while its metallicity is frozen to 0.3 of the solar value and the redshift to 0.05, which corresponds to the mean HIFLUGCS redshift. The temperature and metallicity of the cold component are always fixed to 0.5 and 0.3, respectively. The black curve shows the measured temperature difference between Chandra and XMM-Newton as presented in Table 2.
Current usage metrics show cumulative count of Article Views (full-text article views including HTML views, PDF and ePub downloads, according to the available data) and Abstracts Views on Vision4Press platform.
Data correspond to usage on the plateform after 2015. The current usage metrics is available 48-96 hours after online publication and is updated daily on week days.
Initial download of the metrics may take a while.