Fig. 9
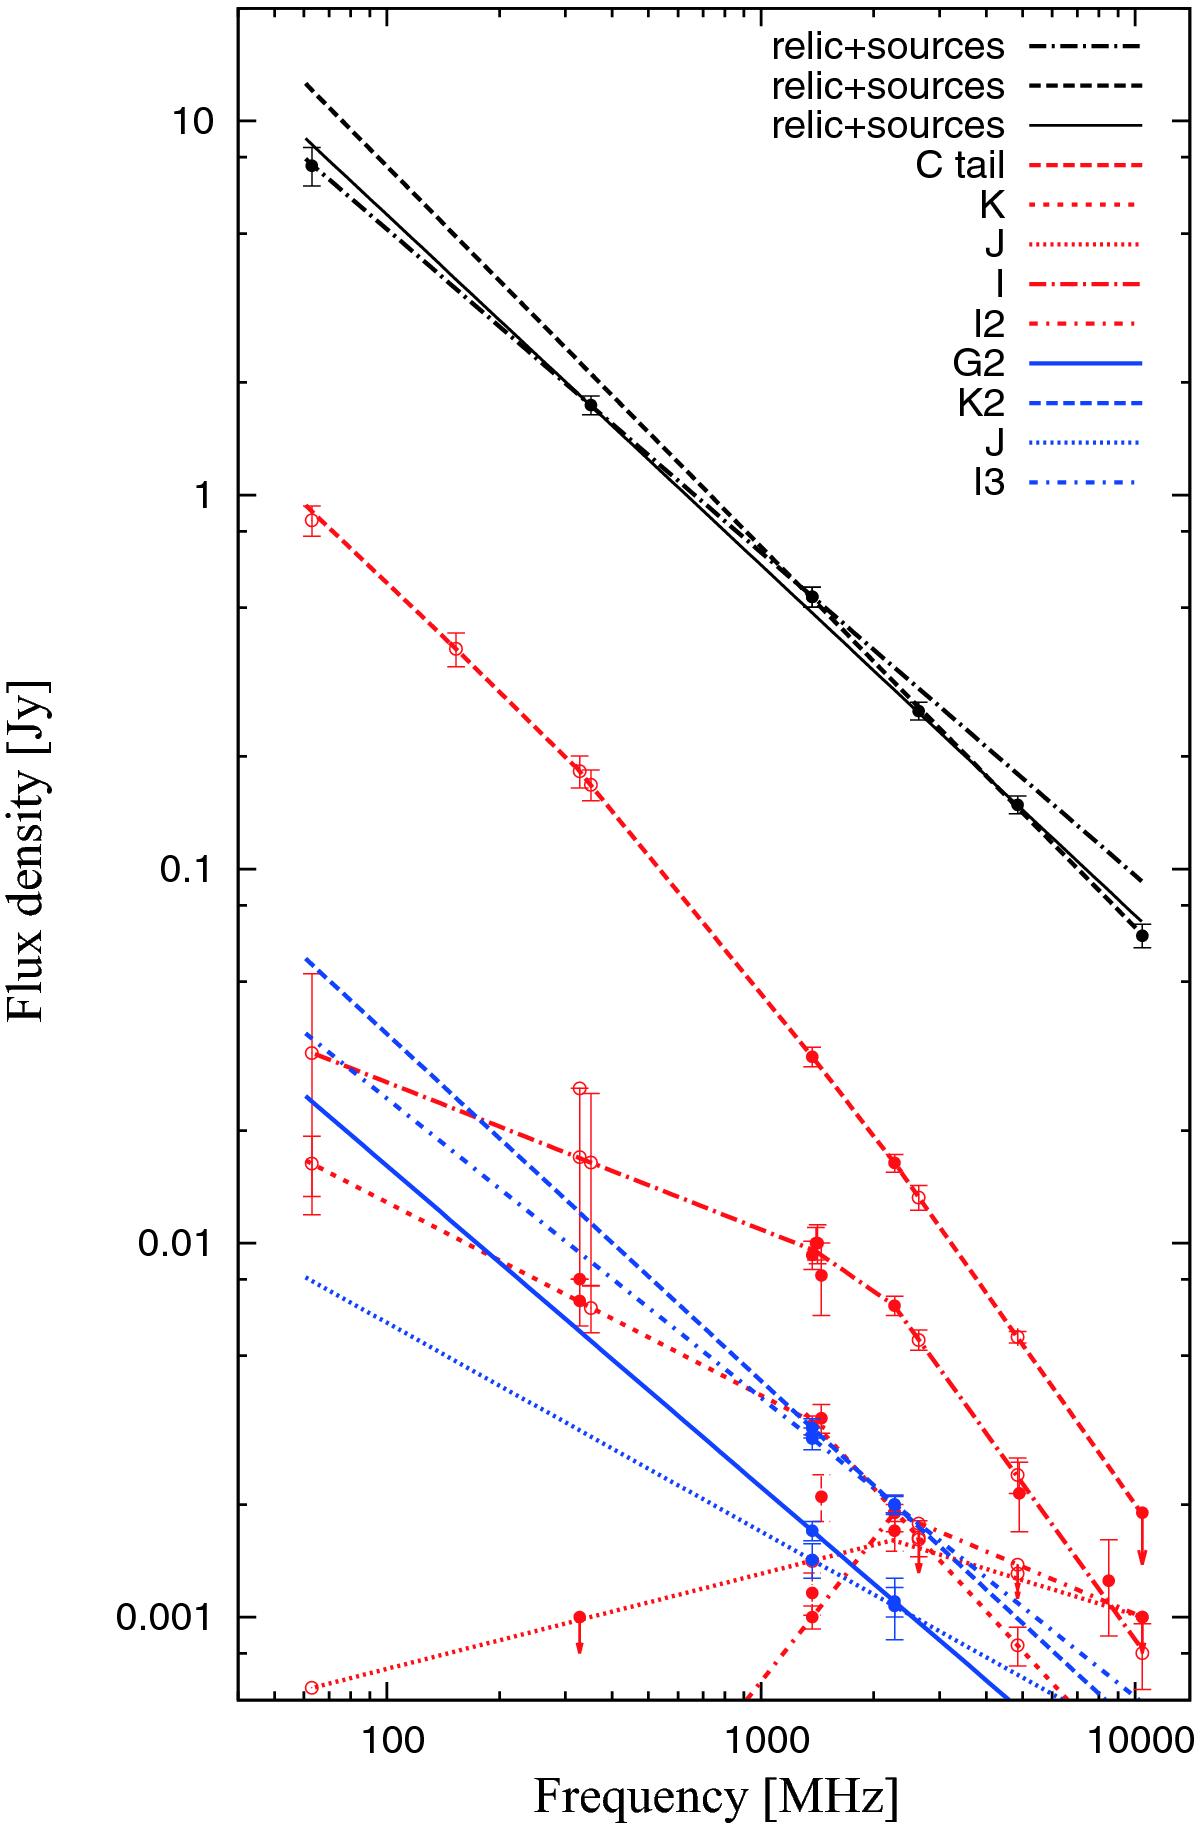
Integrated radio spectra of the different components in the relic region shown in
Fig. 3. In black we show the flux densities
and spectra of the emission from the entire region (relic+sources). The dashed
(![]() ) and dot-dashed
(
) and dot-dashed
(![]() ) lines represent a double
power-law fit to the data. The solid line (
) lines represent a double
power-law fit to the data. The solid line (![]() ) is a single power-law fit. In red
and blue we show the spectra of the discrete sources included in the region. Red
spectra are plotted individually in figures from 4 to 8. Blue spectra are straight
power-law fits to the measured flux densities at 1369 and 2273 MHz. See text for
more details.
) is a single power-law fit. In red
and blue we show the spectra of the discrete sources included in the region. Red
spectra are plotted individually in figures from 4 to 8. Blue spectra are straight
power-law fits to the measured flux densities at 1369 and 2273 MHz. See text for
more details.
Current usage metrics show cumulative count of Article Views (full-text article views including HTML views, PDF and ePub downloads, according to the available data) and Abstracts Views on Vision4Press platform.
Data correspond to usage on the plateform after 2015. The current usage metrics is available 48-96 hours after online publication and is updated daily on week days.
Initial download of the metrics may take a while.