Fig. 3
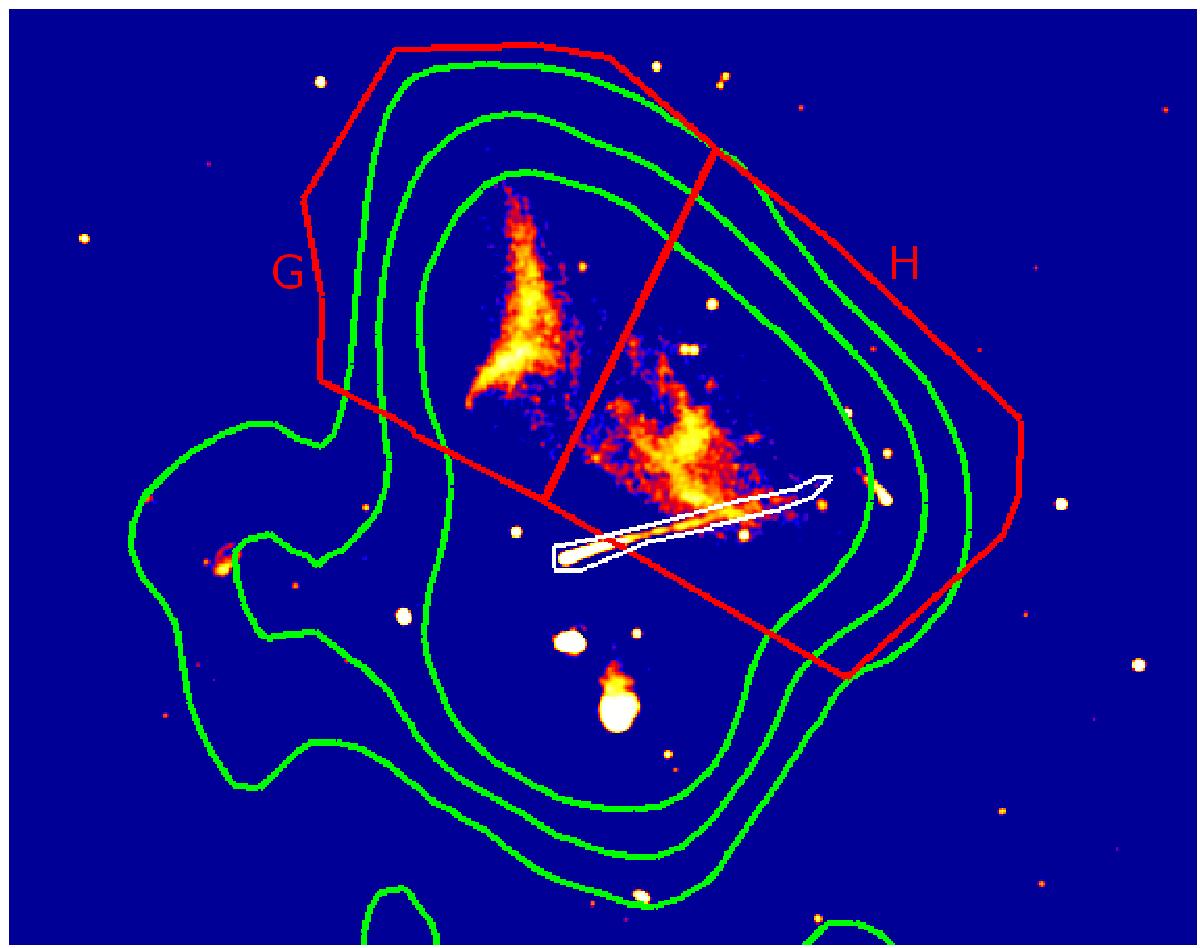
Regions used for the spectra computation. The red region marks the region considered for the relic spectrum computation. The total region is further subdivided into regions G and H. In color scale the WSRT high-resolution image with the green contours from the 2640 MHz Effelsberg image overplotted. The white region mark the C source.
Current usage metrics show cumulative count of Article Views (full-text article views including HTML views, PDF and ePub downloads, according to the available data) and Abstracts Views on Vision4Press platform.
Data correspond to usage on the plateform after 2015. The current usage metrics is available 48-96 hours after online publication and is updated daily on week days.
Initial download of the metrics may take a while.