Fig. 6
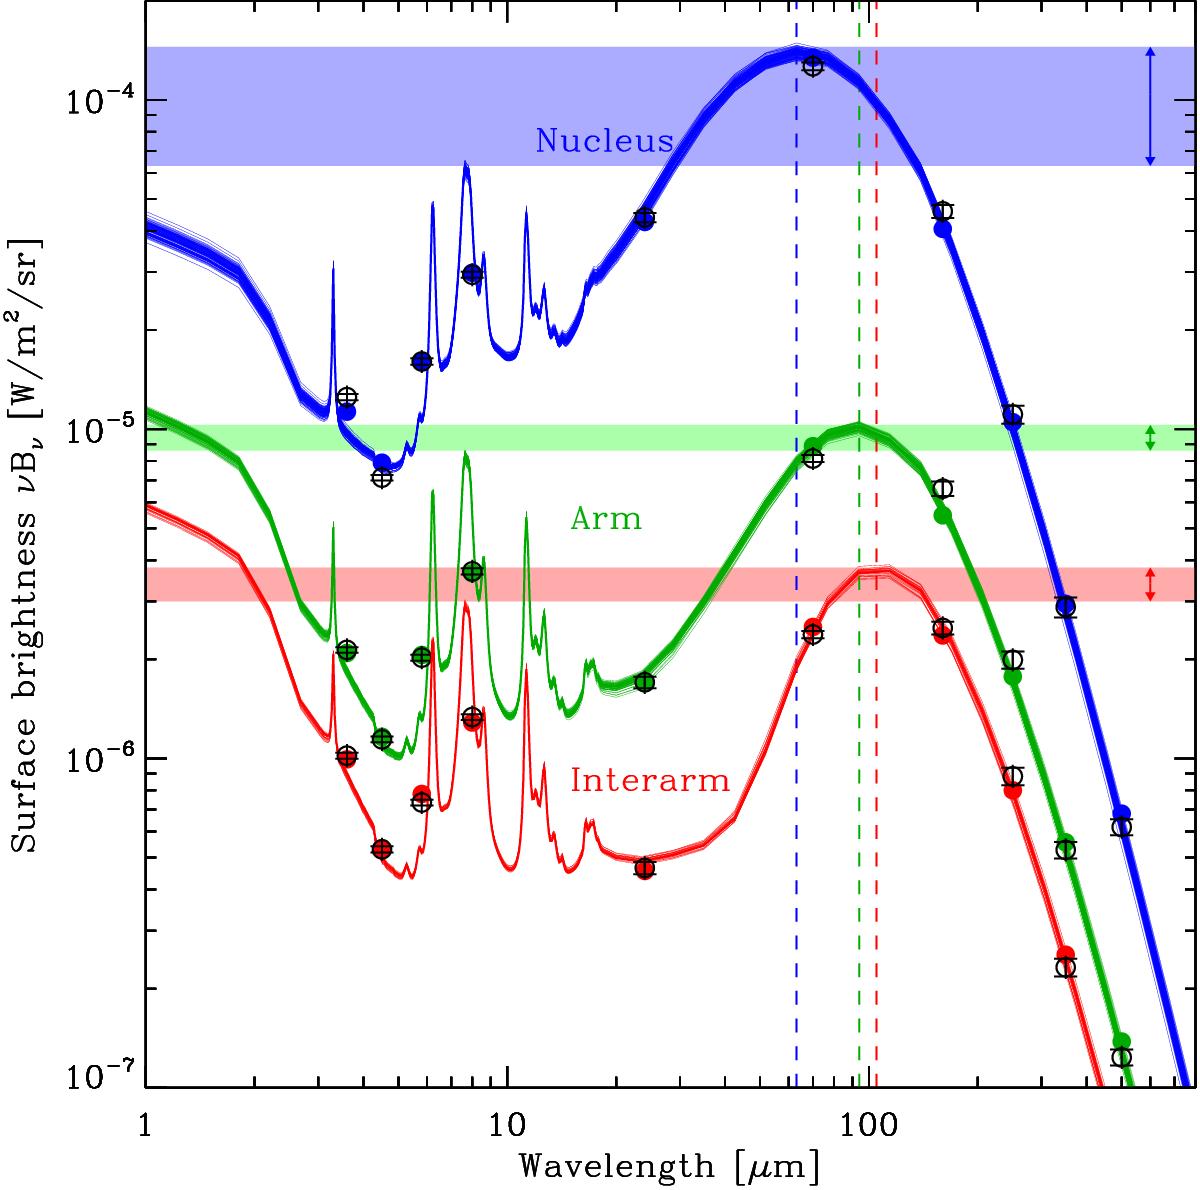
Selected SEDs of M 83. They correspond to three pixels: one in the central region (Nucleus; blue); one on the spiral arm (Arm; green); one in the interarm region (Interarm; red). These three pixels are masked in the same colors in Fig. 1. The open circles with error bars are the observed photometry. The solid lines are the Galliano et al. (2011) model fit to these fluxes. The widths of the line indicate the levels of uncertainty of the model fit. The solid circles are the synthetic photometry computed from the model. The vertical dashed line shows the peak wavelength of the SED, which is an indication of the dust temperature. The horizontal stripes show the difference between the peak fluxes of the 7.7μm PAH feature and the FIR. They demonstrate that the PAH-to-FIR peak ratio, which can be translated to the PAH-to-dust mass ratio (fPAH), is similar in the arm and interarm regions, but is lower in the nucleus.
Current usage metrics show cumulative count of Article Views (full-text article views including HTML views, PDF and ePub downloads, according to the available data) and Abstracts Views on Vision4Press platform.
Data correspond to usage on the plateform after 2015. The current usage metrics is available 48-96 hours after online publication and is updated daily on week days.
Initial download of the metrics may take a while.