Fig. 19
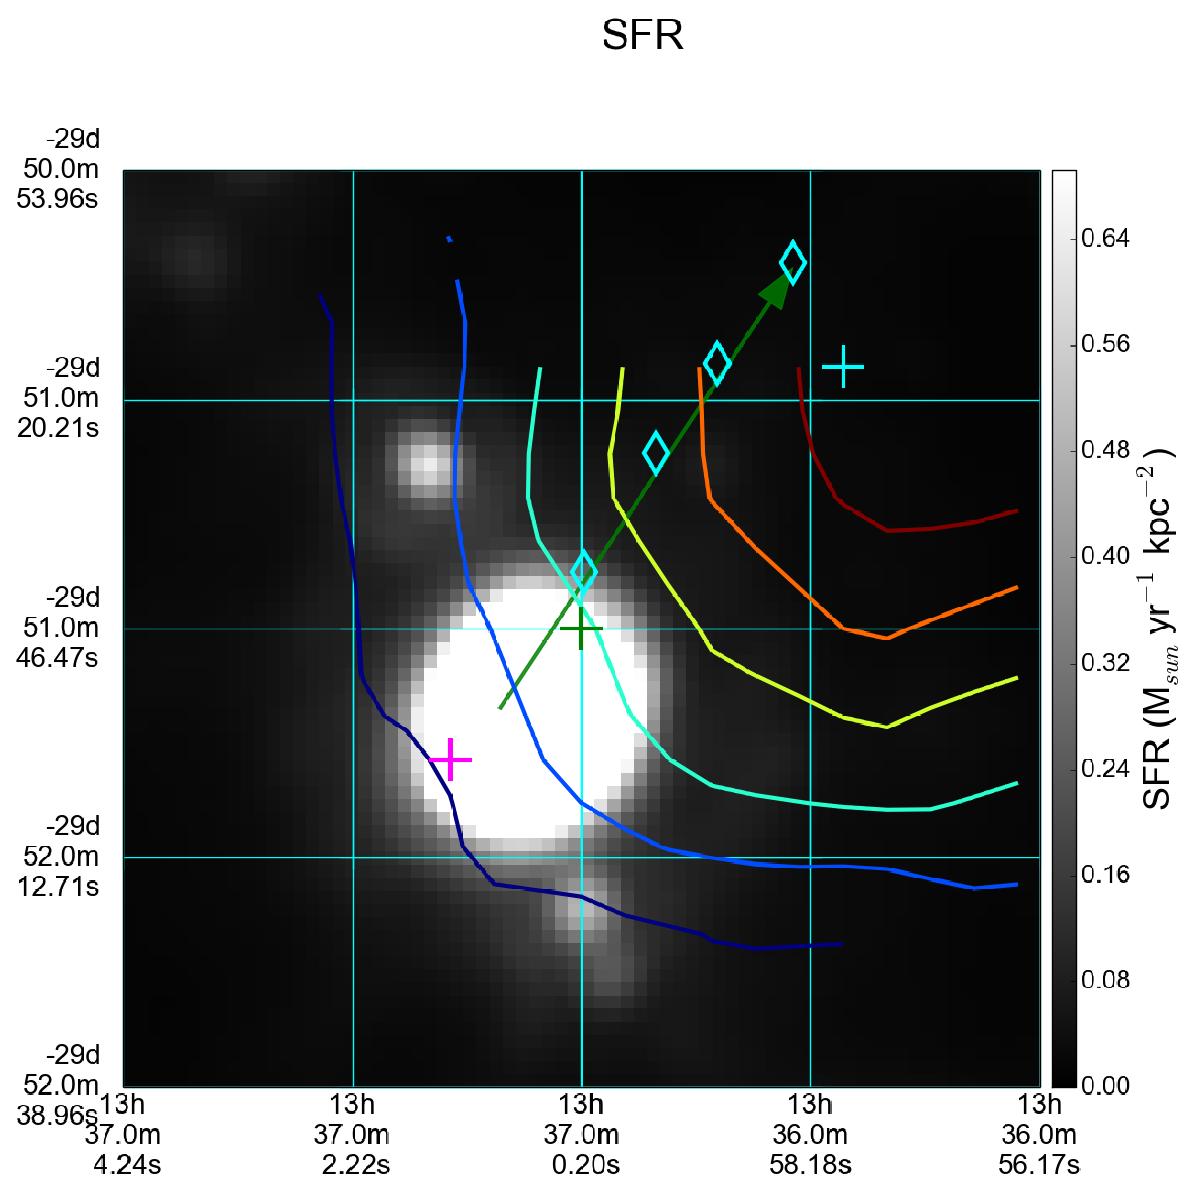
Graph showing the contours of Pth on the SFR map. The gray scale of SFR is recorded in the colorbar to the right. The contours of Pth ranges between 4 × 10⁵ (blue) and 2.4 × 106 cm-3 K (red) and have spacings equal to 4 × 105 cm-3 K. The crosses mark the locations of three pixels chosen from Fig. 5 (see text for more details). The four cyan diamonds mark the locations of four radio sources observed in Maddox et al. (2006).
Current usage metrics show cumulative count of Article Views (full-text article views including HTML views, PDF and ePub downloads, according to the available data) and Abstracts Views on Vision4Press platform.
Data correspond to usage on the plateform after 2015. The current usage metrics is available 48-96 hours after online publication and is updated daily on week days.
Initial download of the metrics may take a while.