Fig. 15
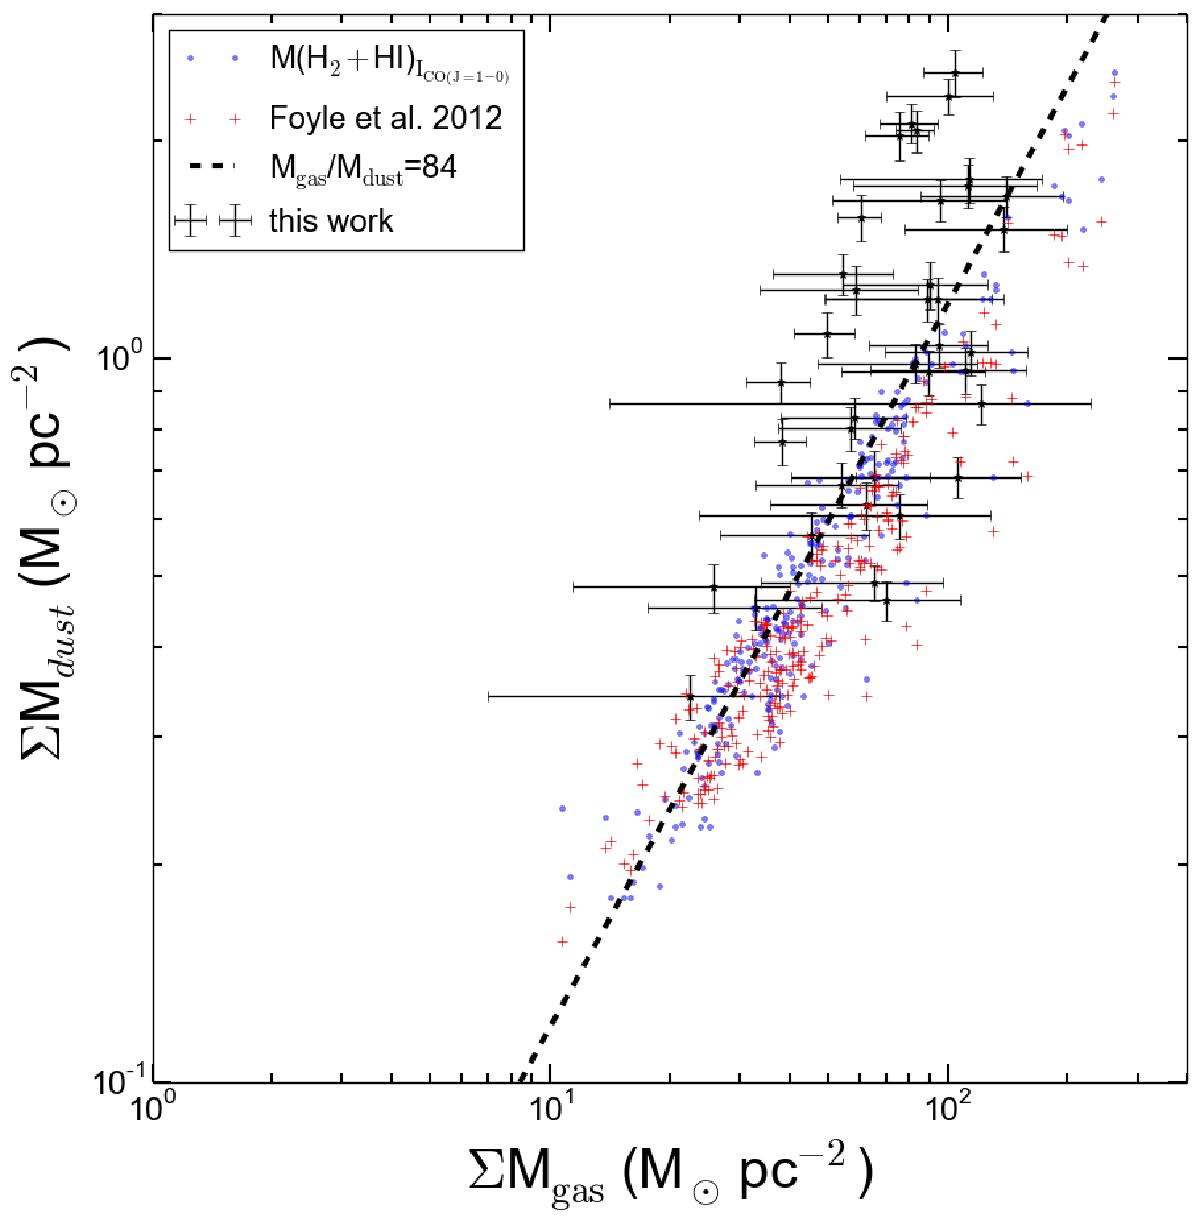
Comparison of the dust molecular gas masses estimated in M 83. Points with error bars are the values derived using the Herschel SPIRE FTS data. Blue points indicate the values estimated with ICO(1 − 0) (XCO = 2 × 1020 cm-2 (K km s-1)-1) when there is no available data from FTS observation. Red crosses indicate the values used in Foyle et al. (2012), in which the G/D is estimated to be 84 ± 4 (dashed line) within M 83.
Current usage metrics show cumulative count of Article Views (full-text article views including HTML views, PDF and ePub downloads, according to the available data) and Abstracts Views on Vision4Press platform.
Data correspond to usage on the plateform after 2015. The current usage metrics is available 48-96 hours after online publication and is updated daily on week days.
Initial download of the metrics may take a while.