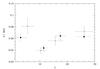
Fig. 6
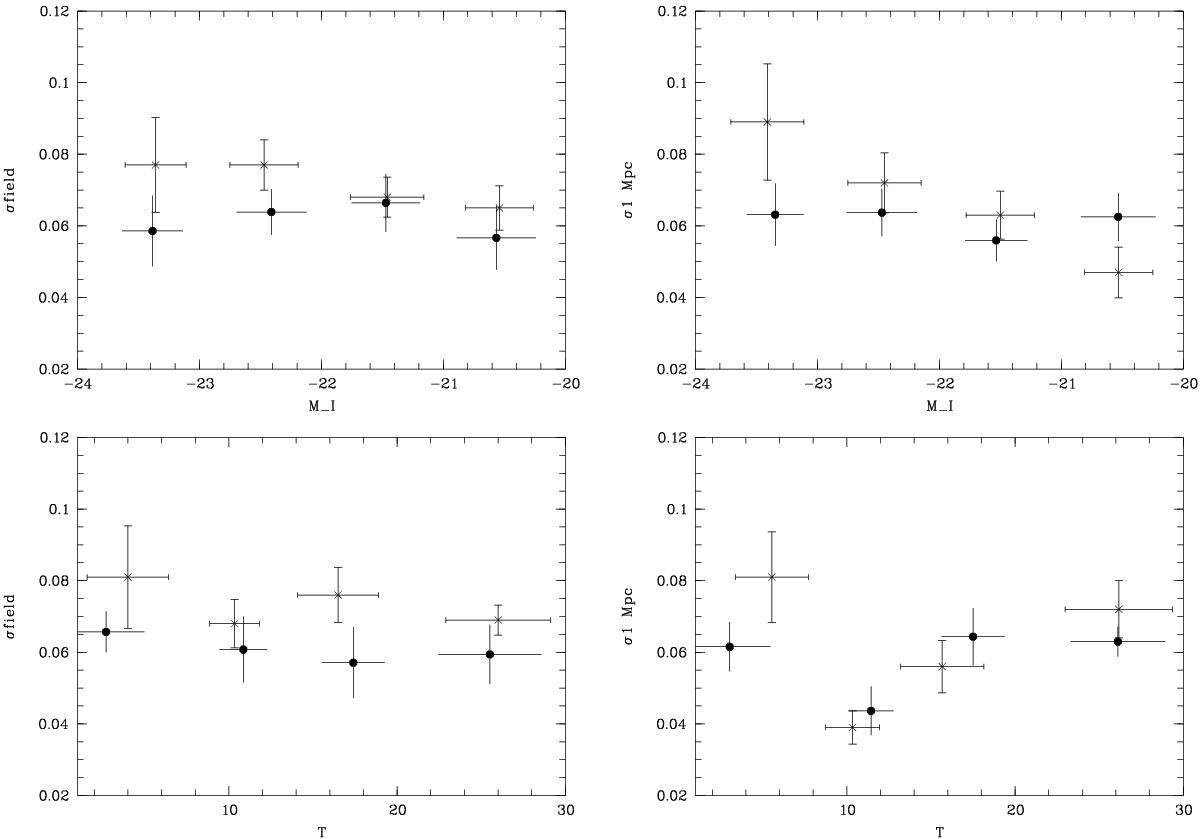
Reduced σ of photo-zs versus I band absolute magnitude (top) and versus galaxy photometric type T (bottom). Left: field galaxies, and right: cluster galaxies inside a 1 Mpc radius. Error bars for the reduced σ are Poissonian and therefore directly proportional to the inverse square root of the number of galaxies within the considered bin. Error bars for each type are simply the second order momentum of the galaxy type distributions in the selected type bins ([1; 7], [8; 12], [13; 19], [20; 31]). Crosses correspond to the G10 values, and circles to the present values. Shifts in types and magnitudes arise from plotting average values for two different samples. Refer to Sect. 2.1 for details of the photometric types.
Current usage metrics show cumulative count of Article Views (full-text article views including HTML views, PDF and ePub downloads, according to the available data) and Abstracts Views on Vision4Press platform.
Data correspond to usage on the plateform after 2015. The current usage metrics is available 48-96 hours after online publication and is updated daily on week days.
Initial download of the metrics may take a while.