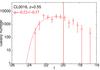
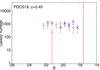
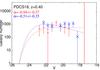
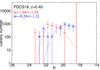
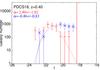
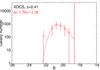
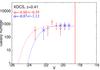
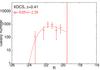
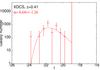
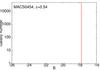
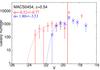
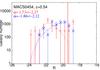
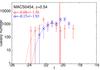
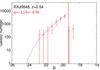
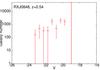
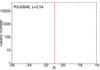
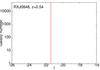
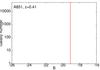
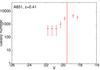
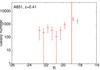
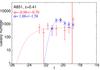
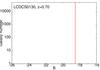
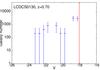
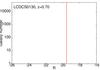
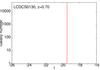
Fig. A.1
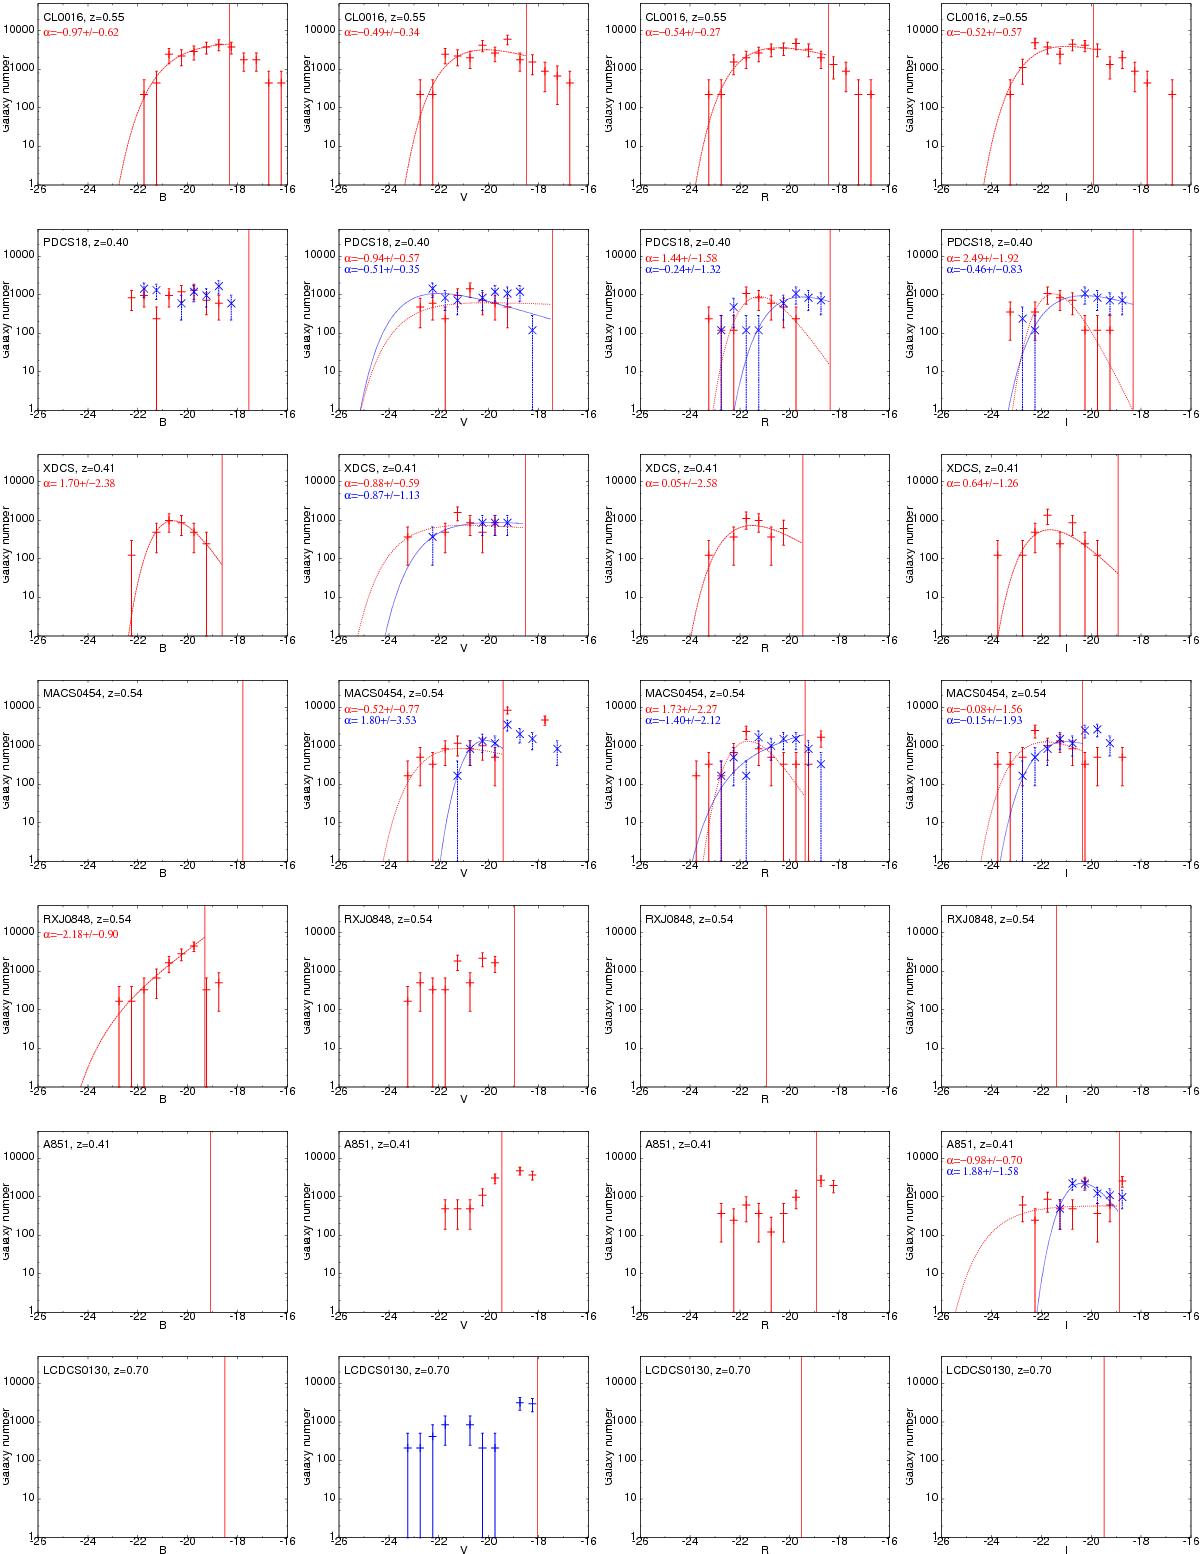
GLFs in the B,V,R and I rest-frame bands (from left to right) for individual clusters ordered by right ascension. Red and blue points correspond to red-sequence and blue GLFs normalized to 1 deg2. The red vertical lines indicate the 90% completeness limit. The red and blue curves show the best Schechter fits to red sequence and blue galaxies, and the faint-end slope parameter (α) is displayed in the corresponding colour. Only galaxies brighter than the 90% completeness limit are taken into account in the fits. Also, we only show GLFs richer than 20 galaxies after the colour separation and after subtracting the field.
Current usage metrics show cumulative count of Article Views (full-text article views including HTML views, PDF and ePub downloads, according to the available data) and Abstracts Views on Vision4Press platform.
Data correspond to usage on the plateform after 2015. The current usage metrics is available 48-96 hours after online publication and is updated daily on week days.
Initial download of the metrics may take a while.