Free Access
Fig. 14
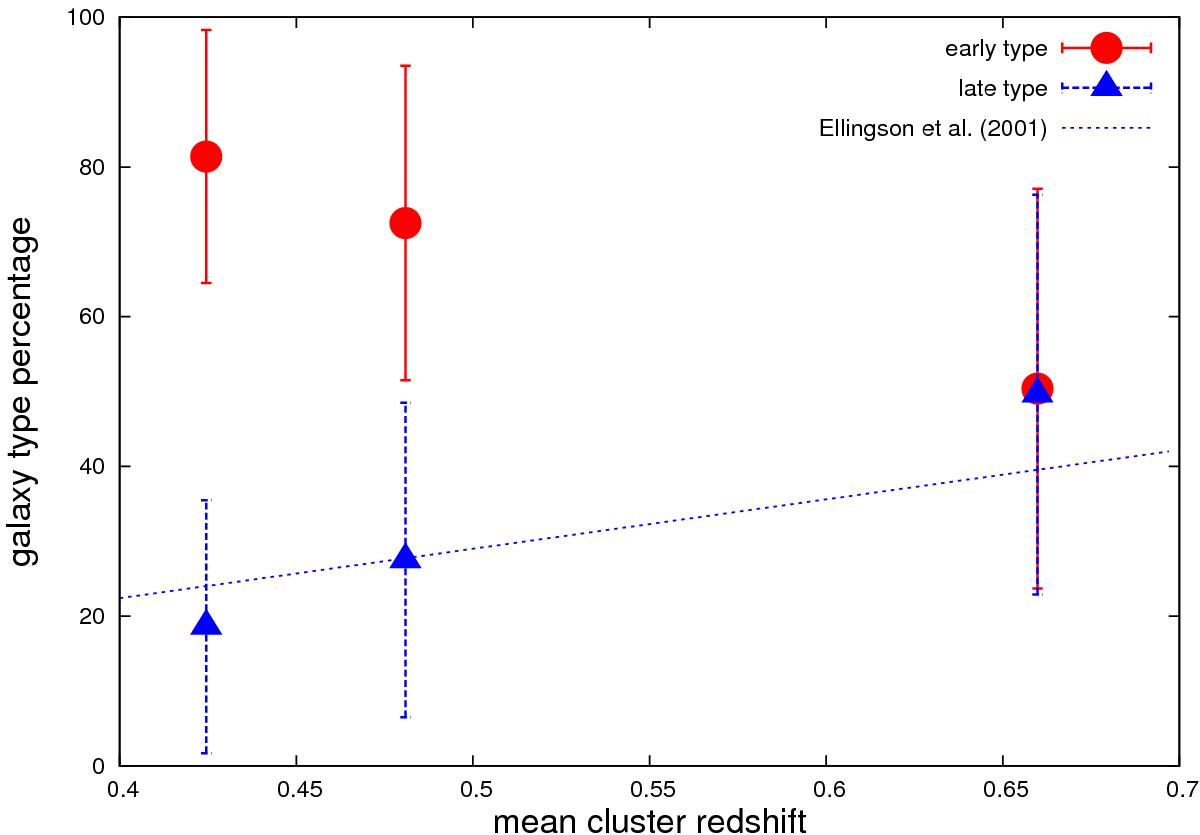
Evolution of cluster galaxy type percentages with redshift. Each point represents the mean value of a percentage over four clusters. Red dots are red (early type) galaxies and blue triangles correspond to blue (late type) galaxies. The blue dashed line corresponds to the blue fraction from Ellingson et al. (2001).
Current usage metrics show cumulative count of Article Views (full-text article views including HTML views, PDF and ePub downloads, according to the available data) and Abstracts Views on Vision4Press platform.
Data correspond to usage on the plateform after 2015. The current usage metrics is available 48-96 hours after online publication and is updated daily on week days.
Initial download of the metrics may take a while.