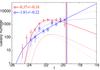
Fig. 13
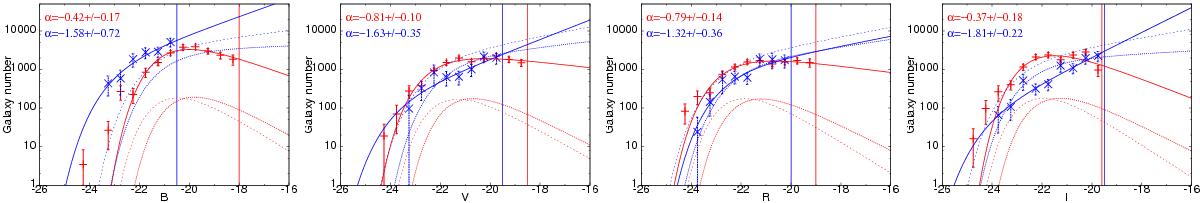
Cluster and field GLFs in the B,V,R, and I rest-frame bands (from left to right). Red and blue points respectively correspond to red-sequence and blue stacked cluster GLFs normalized to 1 deg2. The red and blue plain curves show the best Schechter fits to red-sequence and blue galaxies and the red and blue vertical lines indicate the corresponding 90% completeness limits. The slope of the fit α is given for each population. Refer to Table 2 for cluster best Schechter fit parameters. The thin dotted and dashed curves correspond to the COSMOS field GLFs centered at redshifts z = 0.5 and z = 0.7 normalized to 1 deg2. The separation between red and blue field galaxies is done the same way than for clusters at the corresponding redshift (see text for details).
Current usage metrics show cumulative count of Article Views (full-text article views including HTML views, PDF and ePub downloads, according to the available data) and Abstracts Views on Vision4Press platform.
Data correspond to usage on the plateform after 2015. The current usage metrics is available 48-96 hours after online publication and is updated daily on week days.
Initial download of the metrics may take a while.