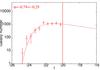
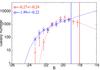
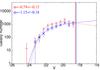
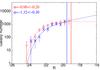
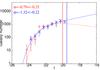
Fig. 12
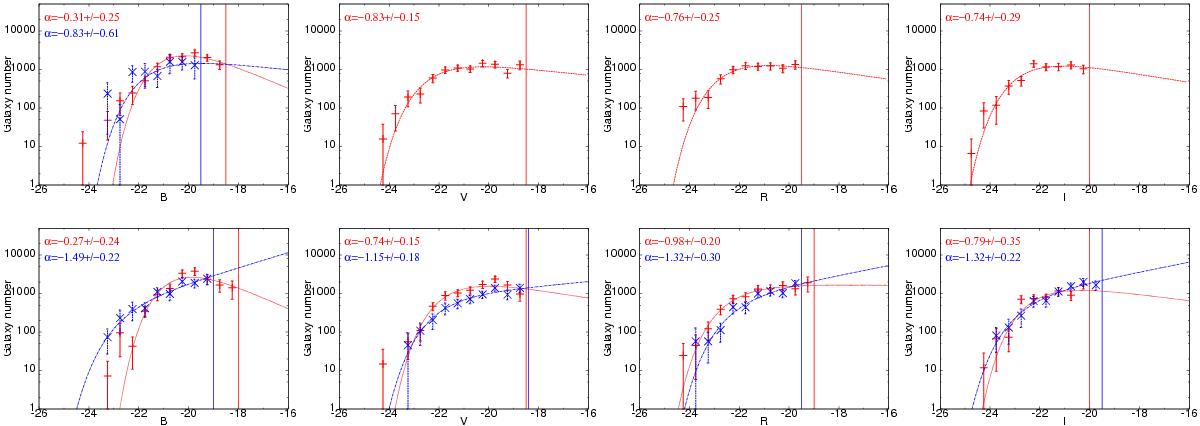
Galaxy luminosity functions in the B,V,R, and I rest-frame bands (from left to right) for stacked clusters in cores and outskirts. The first line of figures is for cluster cores (r ≤ 500 kpc) and the second line of figures for cluster outskirts (500 <r ≤ 1000 kpc). Red and blue points, respectively, correspond to red-sequence and blue GLFs normalized to 1 deg2. The red and blue curves show the best Schechter fits to red-sequence and blue galaxies and the red and blue vertical lines indicate the corresponding 90% completeness limits. The slope of the fit α is given for each population.
Current usage metrics show cumulative count of Article Views (full-text article views including HTML views, PDF and ePub downloads, according to the available data) and Abstracts Views on Vision4Press platform.
Data correspond to usage on the plateform after 2015. The current usage metrics is available 48-96 hours after online publication and is updated daily on week days.
Initial download of the metrics may take a while.