Fig. 11
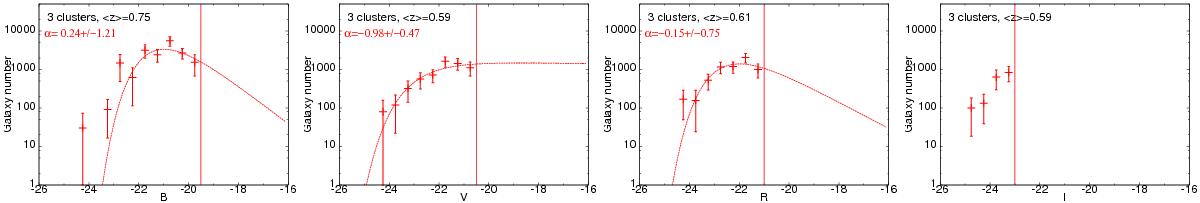
Dependence of red-sequence GLFs on cluster substructures in the B,V,R, and I rest-frame bands (from left to right) for clusters stacked together. Only clusters with detected substructures are considered here (cf. Guennou et al. 2014). Red crosses are red-sequence GLFs normalized to 1 deg2. The vertical red lines indicate the 90% completeness limit. Red curves are the best Schechter fits to red-sequence galaxies. The slope of the fit α is given with the number of clusters and the mean redshift of the stack.
Current usage metrics show cumulative count of Article Views (full-text article views including HTML views, PDF and ePub downloads, according to the available data) and Abstracts Views on Vision4Press platform.
Data correspond to usage on the plateform after 2015. The current usage metrics is available 48-96 hours after online publication and is updated daily on week days.
Initial download of the metrics may take a while.