Fig. 1
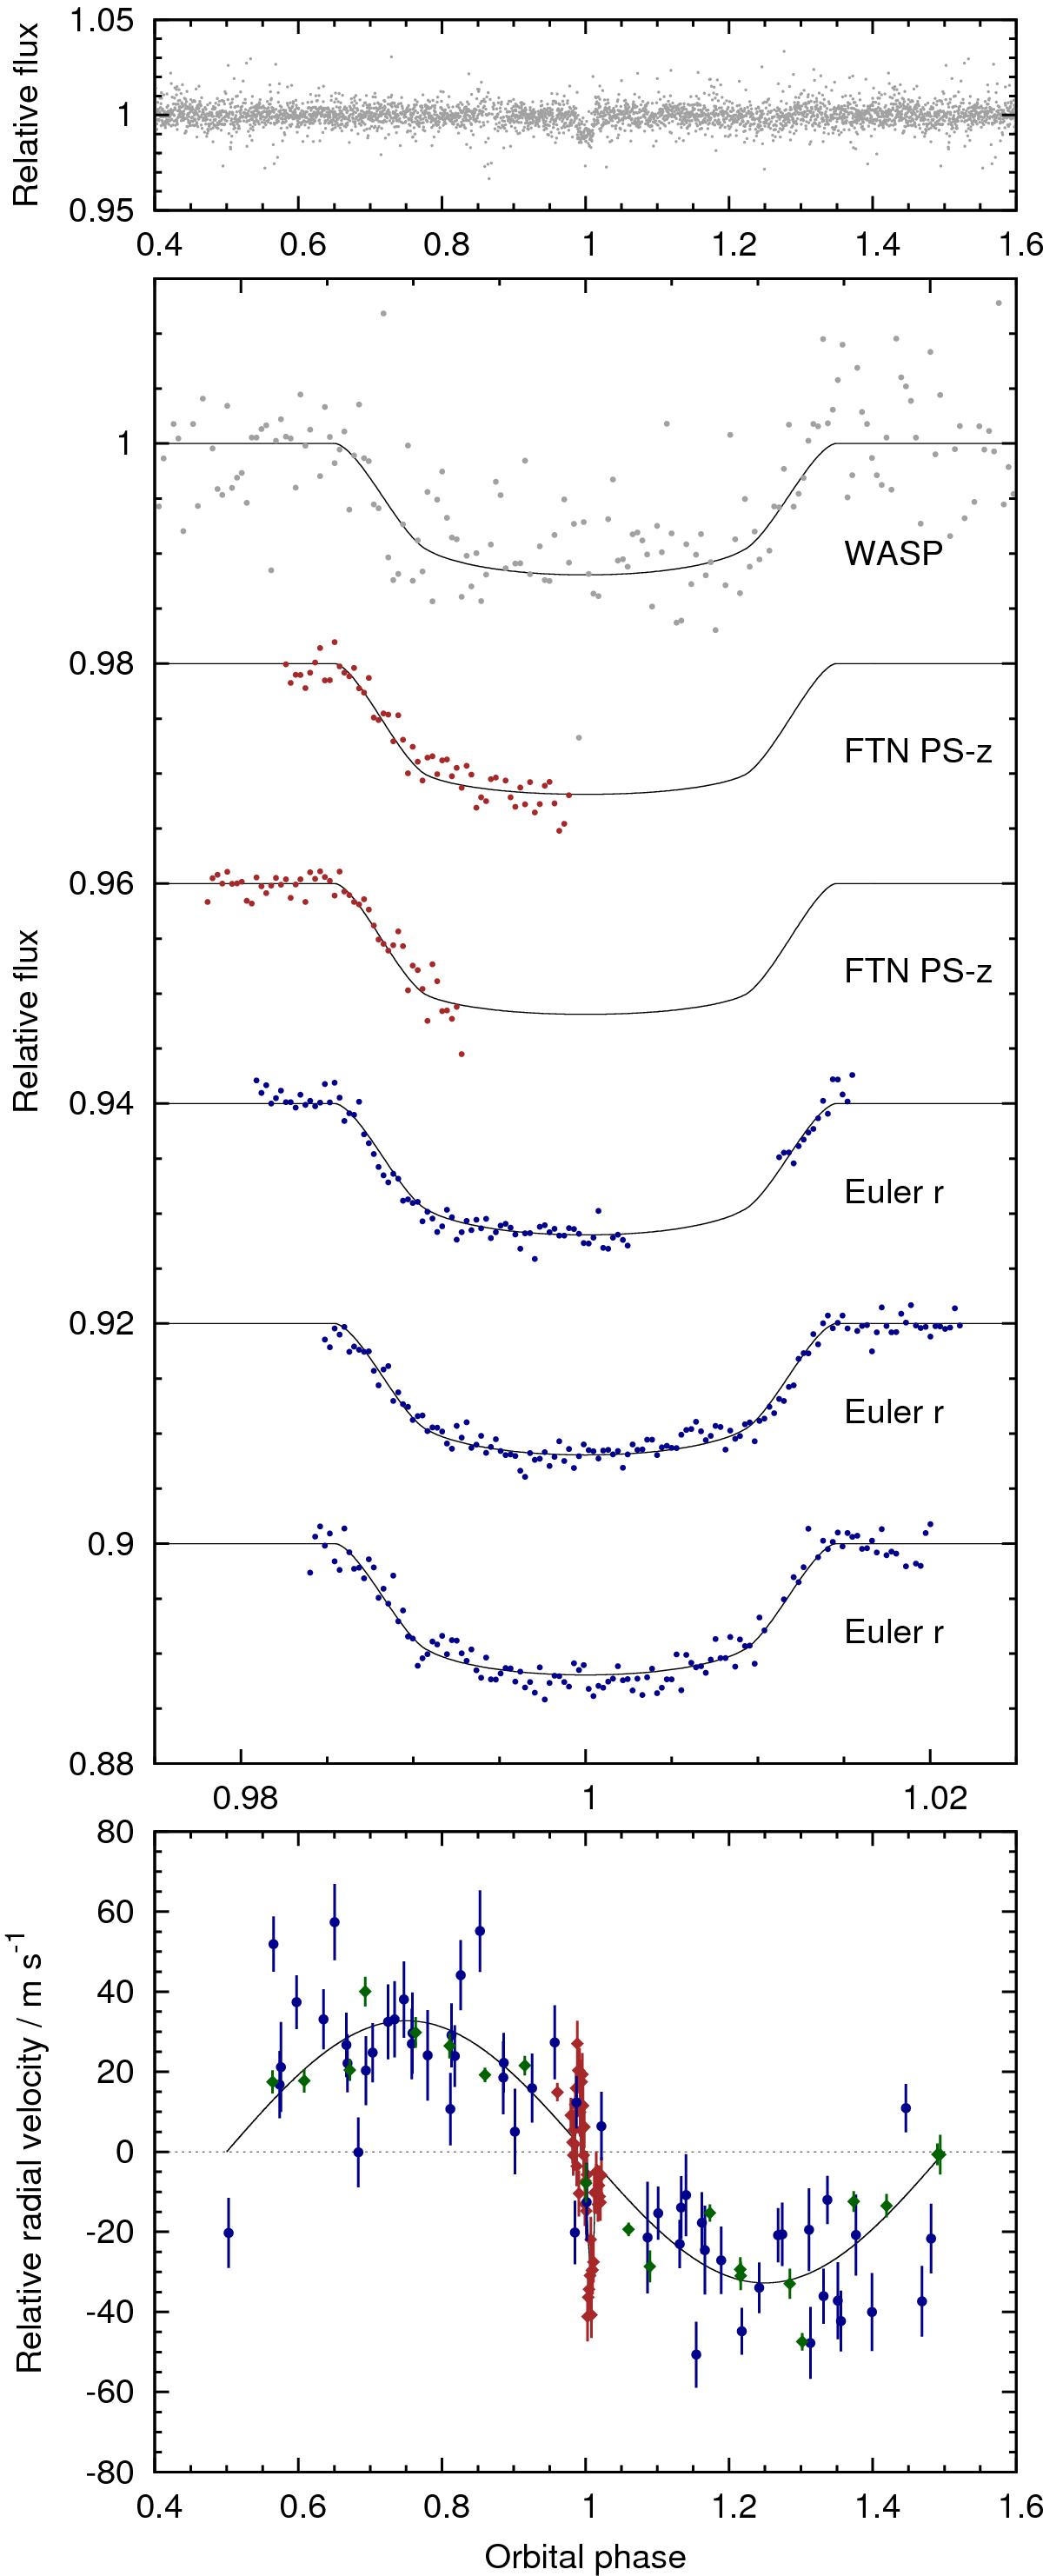
WASP-20b discovery data. Top panel: WASP lightcurve folded on the transit ephemeris. Middle panel: transit lightcurves from facilities as labelled, offset for clarity and binned with a bin width of two minutes. The best-fitting transit model is superimposed. Bottom panel: the radial velocities (CORALIE in blue, HARPS in green and HARPS covering the transit in brown) with the best-fitting circular Keplerian orbit model and the RM effect model.
Current usage metrics show cumulative count of Article Views (full-text article views including HTML views, PDF and ePub downloads, according to the available data) and Abstracts Views on Vision4Press platform.
Data correspond to usage on the plateform after 2015. The current usage metrics is available 48-96 hours after online publication and is updated daily on week days.
Initial download of the metrics may take a while.