Free Access
Fig. 4
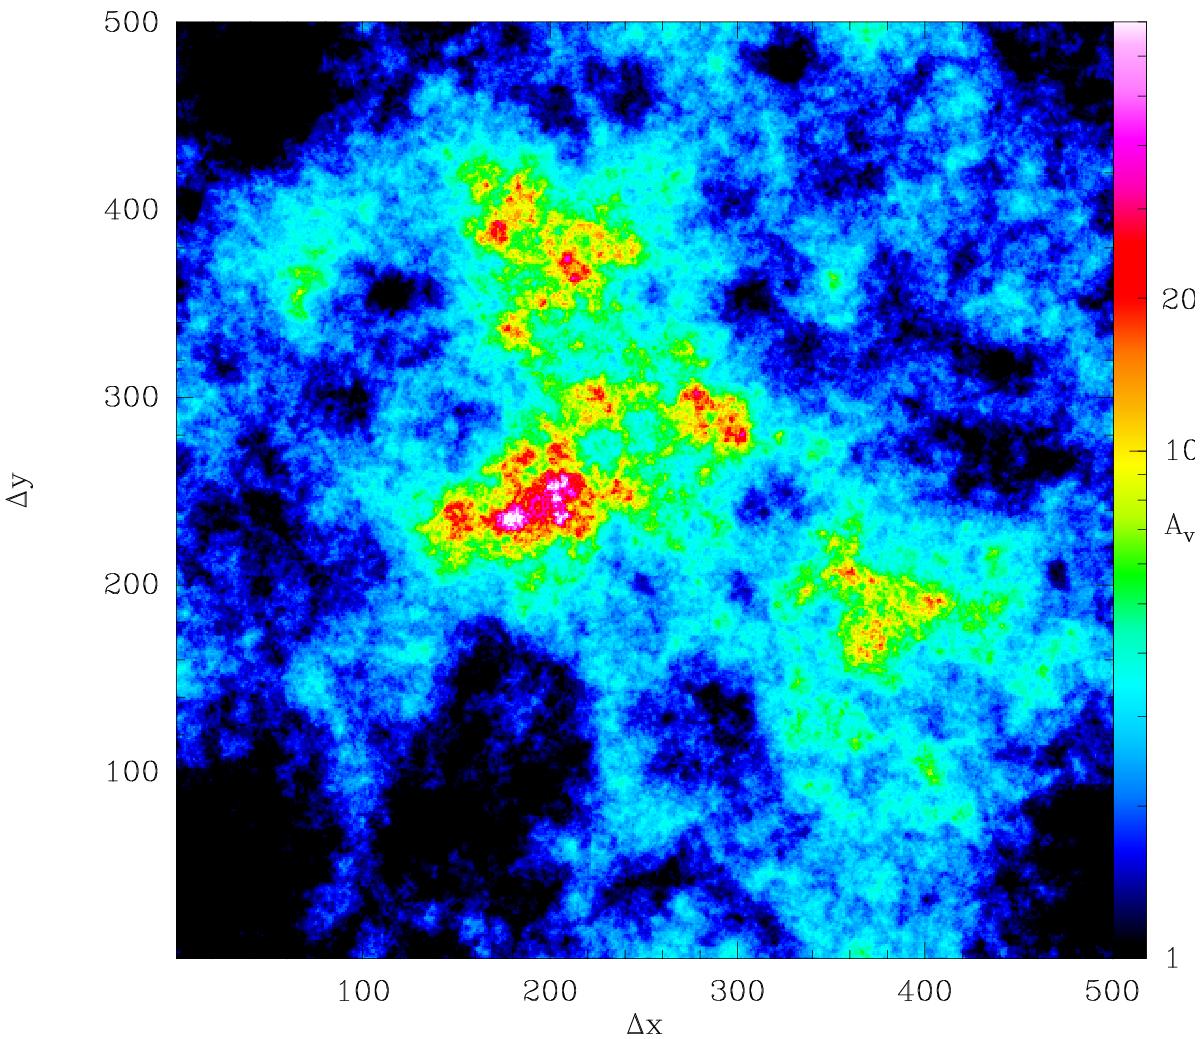
Simulated map (500 × 500 pixels) characterized by a PDF with lognormal part and power-law tail, derived from a fractional Brownian motion (fBm) map with a power spectral index of 2.8. The column densities are expressed in Av.
Current usage metrics show cumulative count of Article Views (full-text article views including HTML views, PDF and ePub downloads, according to the available data) and Abstracts Views on Vision4Press platform.
Data correspond to usage on the plateform after 2015. The current usage metrics is available 48-96 hours after online publication and is updated daily on week days.
Initial download of the metrics may take a while.