Free Access
Fig. B.4
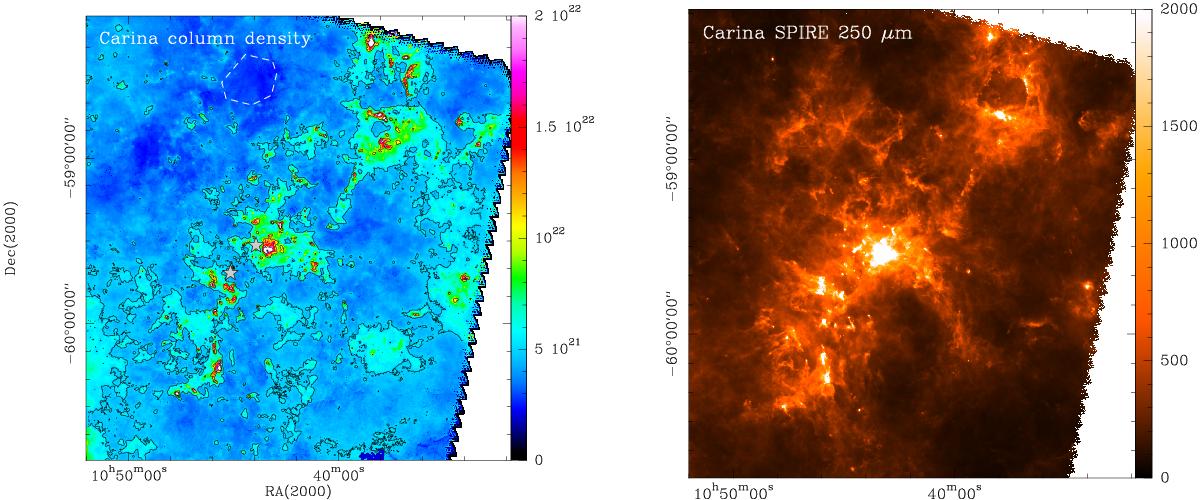
Left: Herschel column density map of Carina in [cm-2]. The contour levels are 5, 10, and 20 × 1021 cm-2. All other parameters as in Fig. B.1. Right: SPIRE 250 μm map in units [MJy/sr]. The gray stars indicate the location of the OB clusters Tr14 and Tr16.
Current usage metrics show cumulative count of Article Views (full-text article views including HTML views, PDF and ePub downloads, according to the available data) and Abstracts Views on Vision4Press platform.
Data correspond to usage on the plateform after 2015. The current usage metrics is available 48-96 hours after online publication and is updated daily on week days.
Initial download of the metrics may take a while.