Fig. B.1
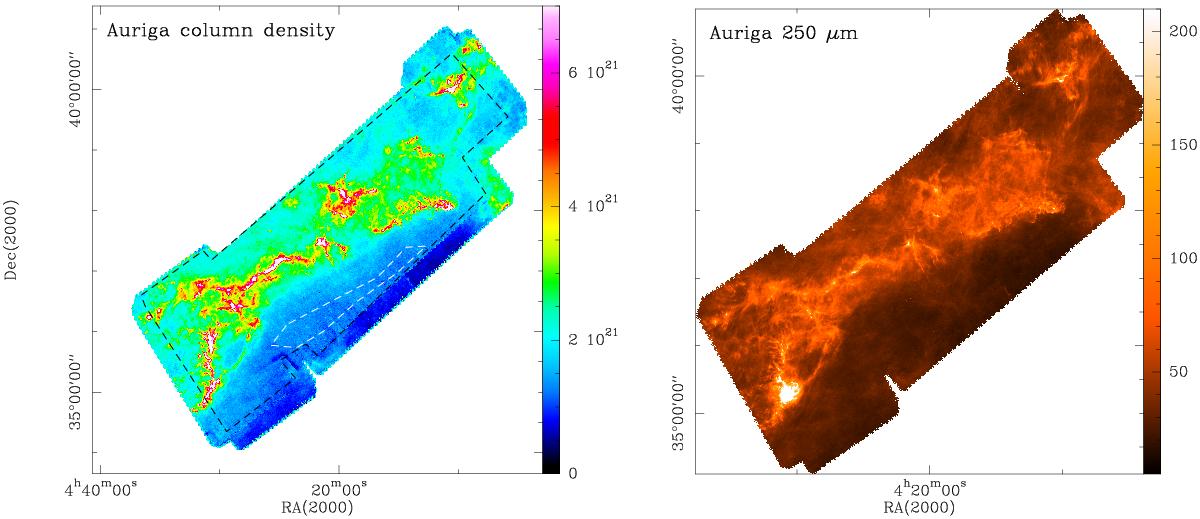
Left: Herschel column density map of the Auriga cloud in [cm-2]. The black dashed polygon indicates the pixels from which the PDF was determined. This is the common overlap region of SPIRE and PACS in which the column density map was determined from the SED fit using the 4 wavelengths. Outside this polygon, the fit relies only on SPIRE and it less reliable. The white polygon outlines the area used for determining the background/foreground level of contamination of the map. Right: SPIRE 250 μm map in units [MJy/sr].
Current usage metrics show cumulative count of Article Views (full-text article views including HTML views, PDF and ePub downloads, according to the available data) and Abstracts Views on Vision4Press platform.
Data correspond to usage on the plateform after 2015. The current usage metrics is available 48-96 hours after online publication and is updated daily on week days.
Initial download of the metrics may take a while.