Fig. A.1
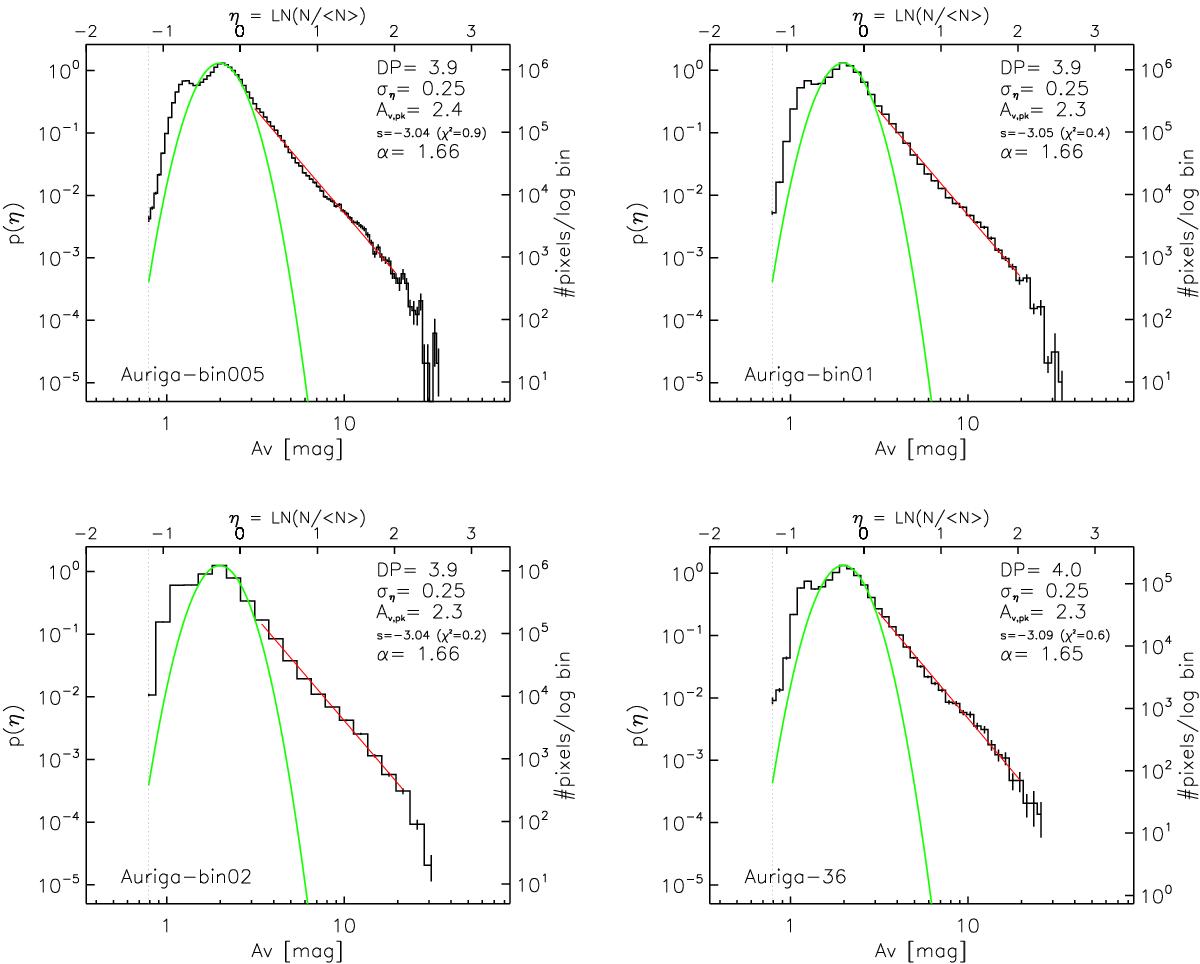
PDFs obtained from the orginal (not LOS-corrected) Auriga column density map with different bin sizes (0.05, 0.1, and 0.2) and a PDF with a binsize of 0.1 but on a grid of 36′′ (lower, right panel). The vertical dashed line indicates the noise level of the map. The left y-axis gives the normalized probability p(η), the right y-axis the number of pixels per log bin. The upper x-axis is the visual extinction and the lower x-axis the logarithm of the normalized column density. The green curve indicates the fitted PDF (we fixed the width of the PDF in order to avoid the low column density component being included). The red line indicates a power-law (linear regression) fit to the high Av tail (the start- and end-point were fixed to the same values for each PDF). Inside each panel, we give the value where the PDF peaks (Apk), the deviation point from lognormal to power-law tail (DP), the dispersion of the fitted PDF (ση), the slope s and the X2 of the fit, and the exponent α of an equivalent spherical density distribution.
Current usage metrics show cumulative count of Article Views (full-text article views including HTML views, PDF and ePub downloads, according to the available data) and Abstracts Views on Vision4Press platform.
Data correspond to usage on the plateform after 2015. The current usage metrics is available 48-96 hours after online publication and is updated daily on week days.
Initial download of the metrics may take a while.