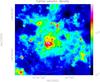
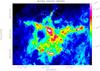
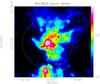
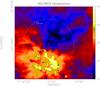
Fig. 12

Zoom into the column density maps of NGC 3603, Carina, and Auriga where we determined the column density profiles shown in Fig. 13. Lower right panel: a temperature map of NGC 3603. The white, dashed circle includes all the pixels we included for the profile and the black, dashed circles for NGC 3603 and Carina outline the area where we observe a possible slope change in the column density profile.
Current usage metrics show cumulative count of Article Views (full-text article views including HTML views, PDF and ePub downloads, according to the available data) and Abstracts Views on Vision4Press platform.
Data correspond to usage on the plateform after 2015. The current usage metrics is available 48-96 hours after online publication and is updated daily on week days.
Initial download of the metrics may take a while.