Free Access
Fig. 4
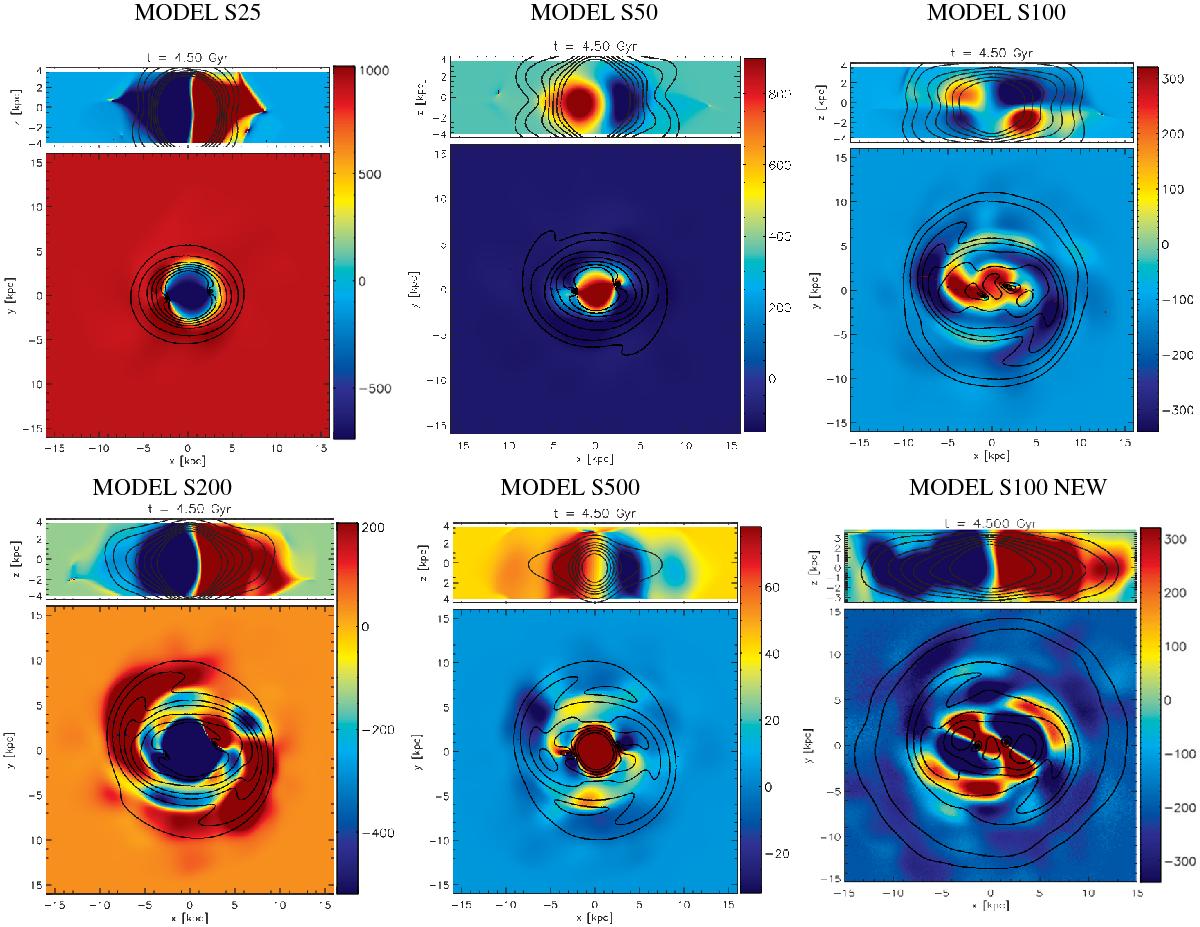
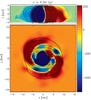
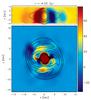
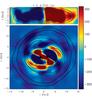
Faraday rotation maps for selected times steps for five models: S25 (top left panel), S50 (top middle panel), S100 (top right panel), S200 (bottom left panel), S500 (bottom middle panel), and S100 NEW (bottom right panel) at the time 4.5 Gyr. The red area denotes the positive RM and blue area denotes the negative RM.
This figure is made of several images, please see below:
Current usage metrics show cumulative count of Article Views (full-text article views including HTML views, PDF and ePub downloads, according to the available data) and Abstracts Views on Vision4Press platform.
Data correspond to usage on the plateform after 2015. The current usage metrics is available 48-96 hours after online publication and is updated daily on week days.
Initial download of the metrics may take a while.