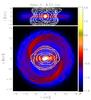
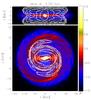
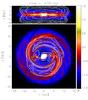
Fig. 2
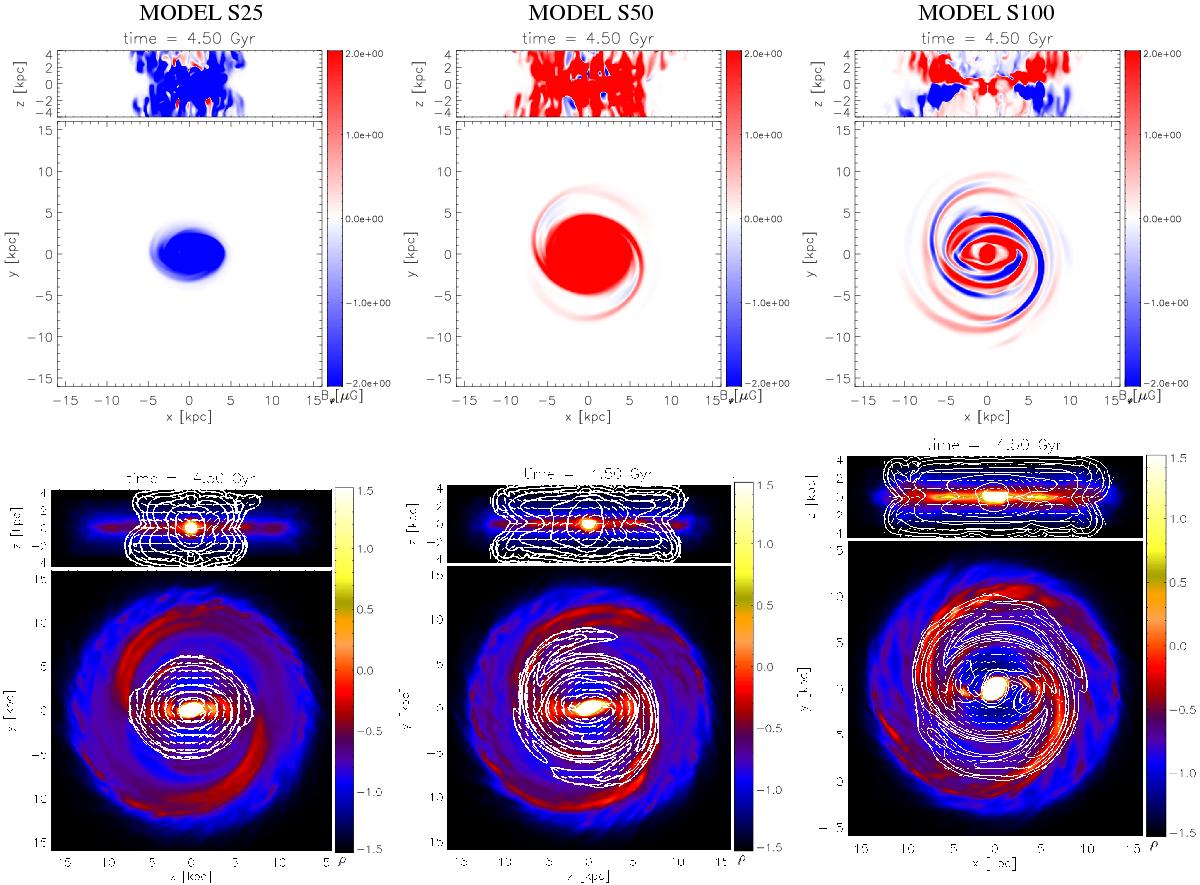
Top panels: distribution of toroidal magnetic field in vertical and horizontal slices through the disk centre for three models: S25 (left panel), S50 (middle panel), and S100 (right panel). Red represents regions with positive toroidal magnetic field, blue with negative, while unmagnetized regions are white. To enhance weaker magnetic field structures in the outer galactic disk (e.g., magnetic arms), the colour scale in the magnetic field maps is saturated. Bottom panels: face-on and edge-on polarization maps for selected time steps for three models: S25 (left panel), S50 (middle panel), and S100 (right panel). Polarized intensity (contours) and polarization angles (dashes) are superimposed onto the column density plots.
Current usage metrics show cumulative count of Article Views (full-text article views including HTML views, PDF and ePub downloads, according to the available data) and Abstracts Views on Vision4Press platform.
Data correspond to usage on the plateform after 2015. The current usage metrics is available 48-96 hours after online publication and is updated daily on week days.
Initial download of the metrics may take a while.