Fig. 8
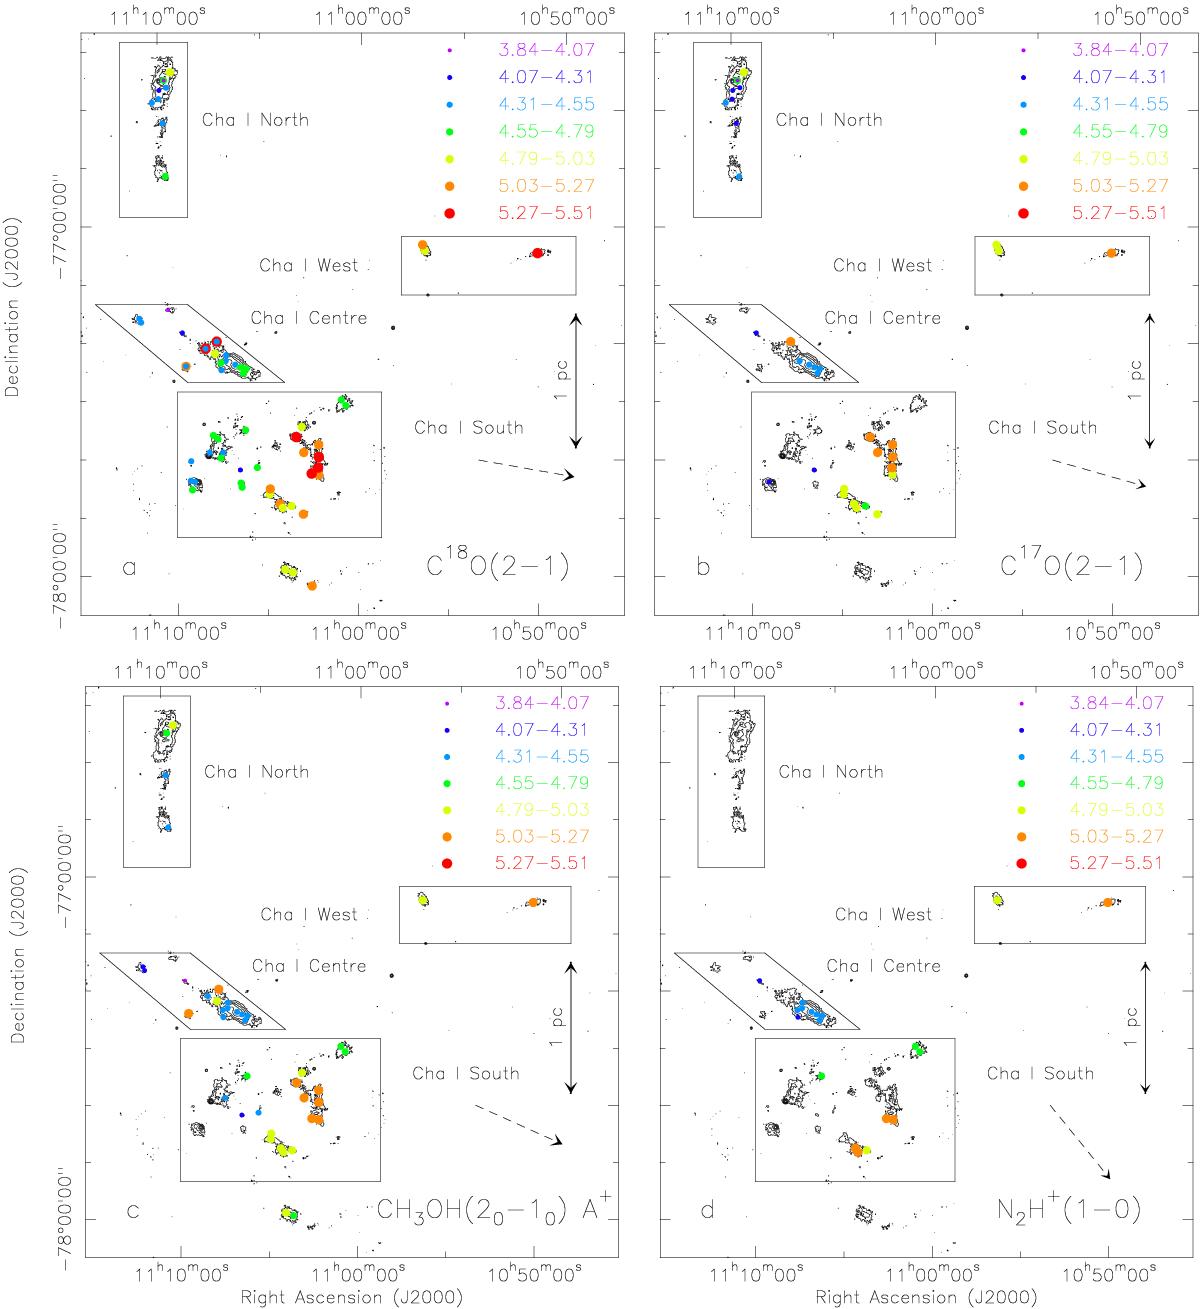
Systemic velocities of the cores in Cha I overplotted on the 870 μm continuum emission map obtained with LABOCA (Belloche et al. 2011a) for the transitions: a) C18O 2–1, b) C17O 2–1, c) CH3OH 20–10 A+, and d) N2H+ 1–0. The contour levels correspond to a, 2a, 4a, 8a, 16a, 32a, with a = 48 mJy/21′′-beam (4σ). The core velocities were derived from Gaussian or hyperfine-structure fits to the observed spectra. The filled circles are colour-coded and increase in size to emphasize increasing velocities. Cores with two velocity components are shown with the lower velocity overplotted onto the higher velocity component. The dashed arrow indicates the position angle of the velocity gradient fit.
Current usage metrics show cumulative count of Article Views (full-text article views including HTML views, PDF and ePub downloads, according to the available data) and Abstracts Views on Vision4Press platform.
Data correspond to usage on the plateform after 2015. The current usage metrics is available 48-96 hours after online publication and is updated daily on week days.
Initial download of the metrics may take a while.