Fig. 4
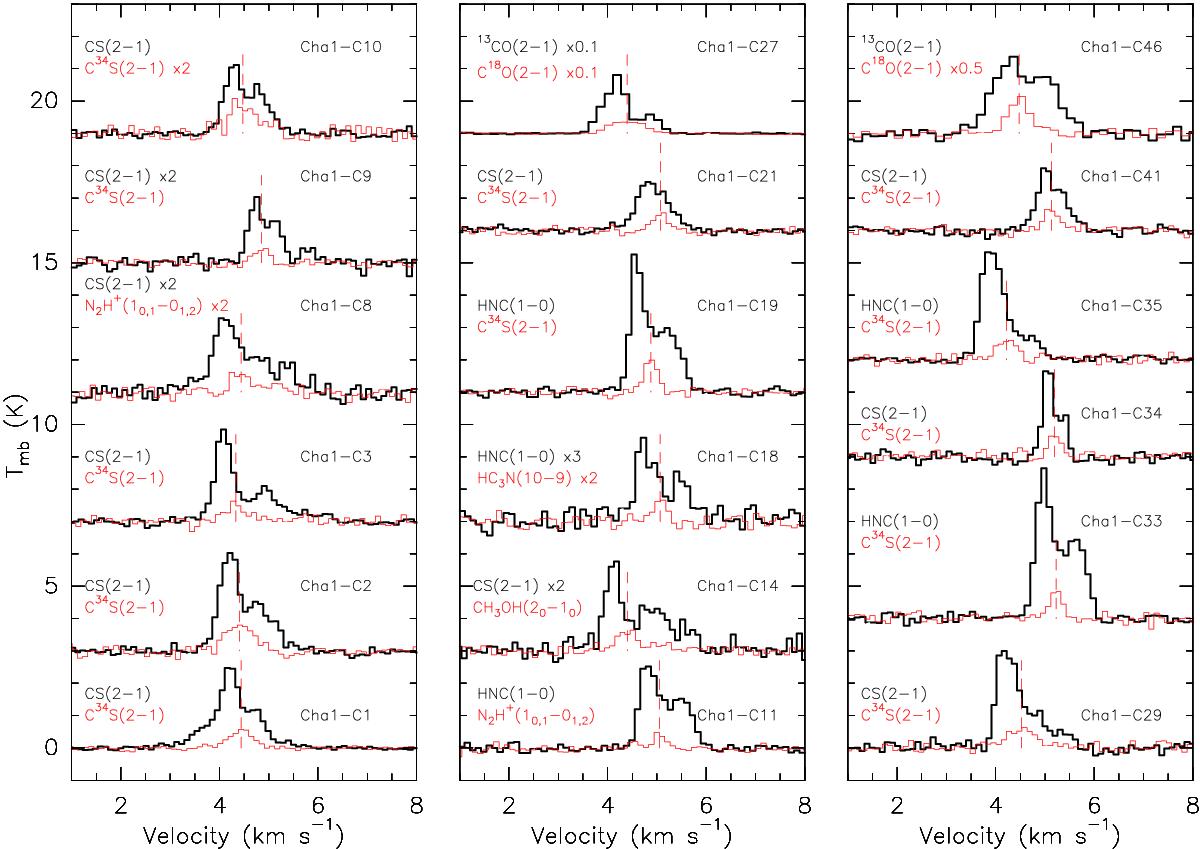
“Infall” signature toward cores in Cha I. The optically thick, self-absorbed transitions are shown with black thick lines and the optically thin transitions with red thin lines. The dashed red line shows the systemic velocity of each core derived from a Gaussian or hyperfine-structure fit to the optically thin line shown in red. The name of the cores is given on the right-hand side of each transition depicted. The factor by which each spectrum was multiplied is given next to the name of the transitions and it corresponds to 1 if not specified.
Current usage metrics show cumulative count of Article Views (full-text article views including HTML views, PDF and ePub downloads, according to the available data) and Abstracts Views on Vision4Press platform.
Data correspond to usage on the plateform after 2015. The current usage metrics is available 48-96 hours after online publication and is updated daily on week days.
Initial download of the metrics may take a while.