Fig. 3
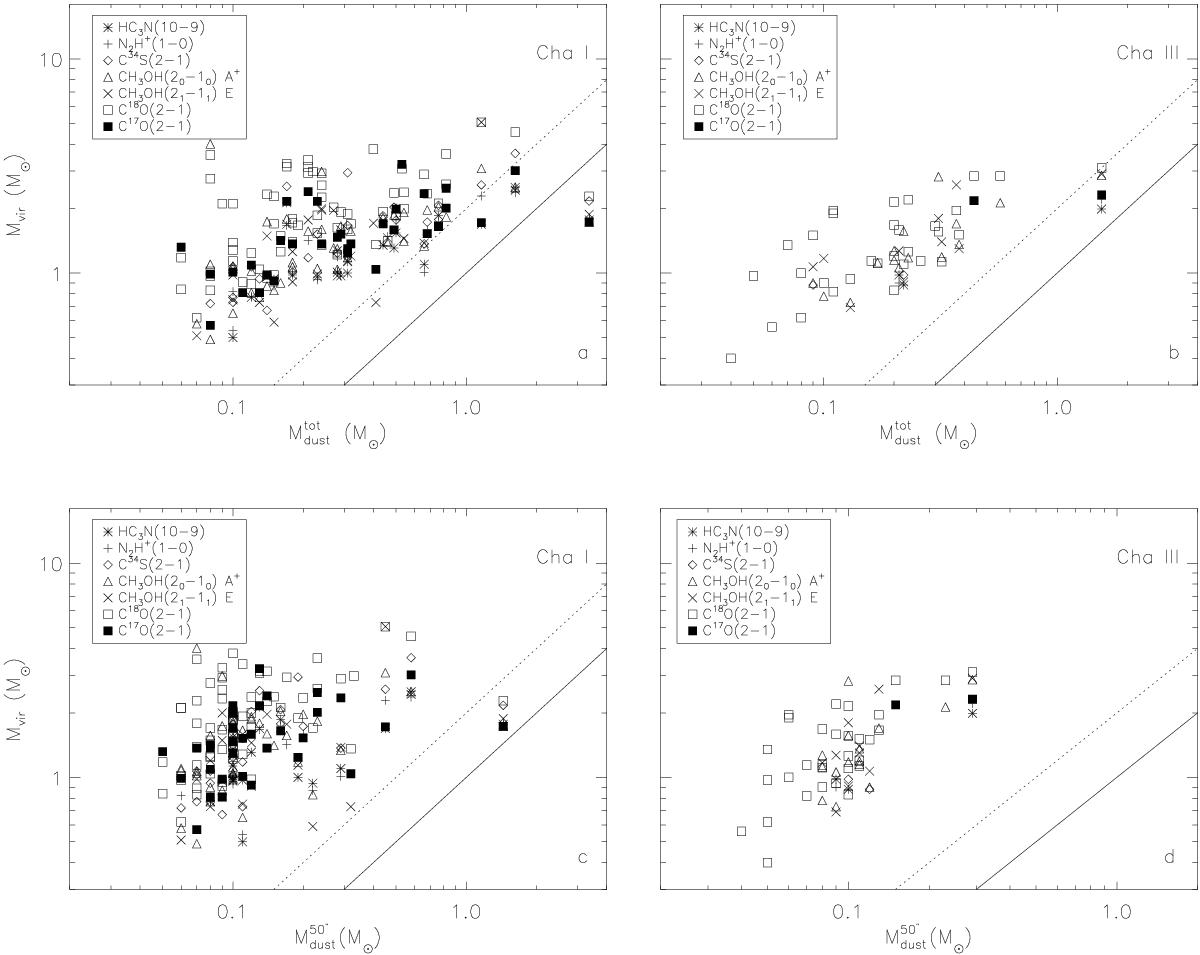
Mass derived from dust emission versus virial mass of the Cha I (a),
c)) and Cha III (b), d)) cores computed for
the transitions HC3N 10−9, N2H+ 1−0, C34S 2−1, CH3OH 20−10 A+, CH3OH 21−11 E,
C18O
2−1, and
C17O
2−1. Panels a and b
show the total mass of the cores while panels c and d show the mass obtained for a
circular aperture of diameter 50′′. The solid line defines the region in which the cores are
virialized (![]() ). The cores located to the right of
the dotted line are considered to be gravitationally bound
(
). The cores located to the right of
the dotted line are considered to be gravitationally bound
(![]() ).
).
Current usage metrics show cumulative count of Article Views (full-text article views including HTML views, PDF and ePub downloads, according to the available data) and Abstracts Views on Vision4Press platform.
Data correspond to usage on the plateform after 2015. The current usage metrics is available 48-96 hours after online publication and is updated daily on week days.
Initial download of the metrics may take a while.