Fig. E.1
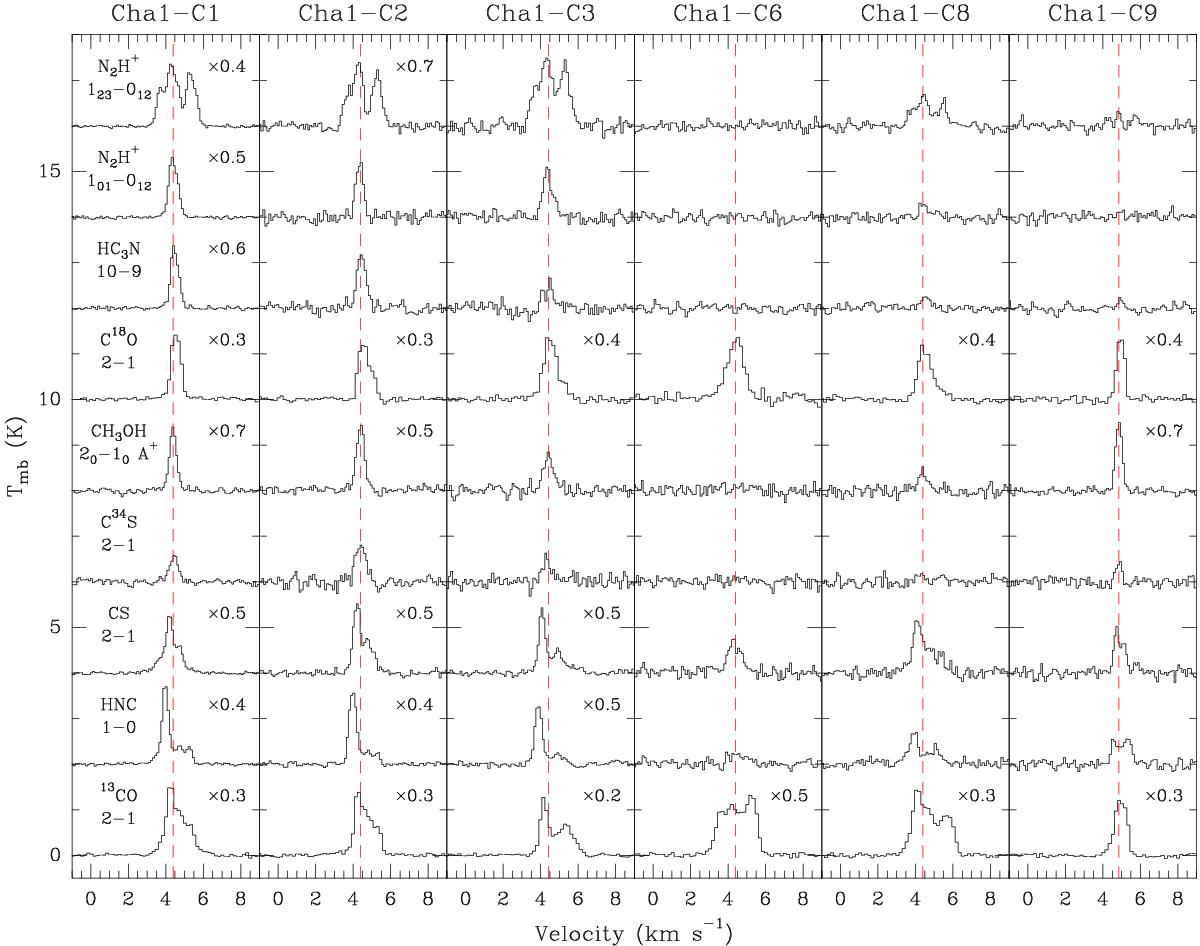
Spectra obtained with APEX and the Mopra telescope toward the Cha I and III sources listed in Table 7, displayed in main-beam temperature scale. Spectra that were rescaled to fit in the figure have their scaling factor indicated on the right. The vertical dashed line marks the systemic velocity as derived from a Gaussian fit to the CH3OH 20–10 A+ transition, except for sources Cha1-C6, Cha1-C24, Cha1-C27, Cha1-C35, and Cha3-C10 for which the C18O 2–1 transition was used.
Current usage metrics show cumulative count of Article Views (full-text article views including HTML views, PDF and ePub downloads, according to the available data) and Abstracts Views on Vision4Press platform.
Data correspond to usage on the plateform after 2015. The current usage metrics is available 48-96 hours after online publication and is updated daily on week days.
Initial download of the metrics may take a while.