Fig. 12
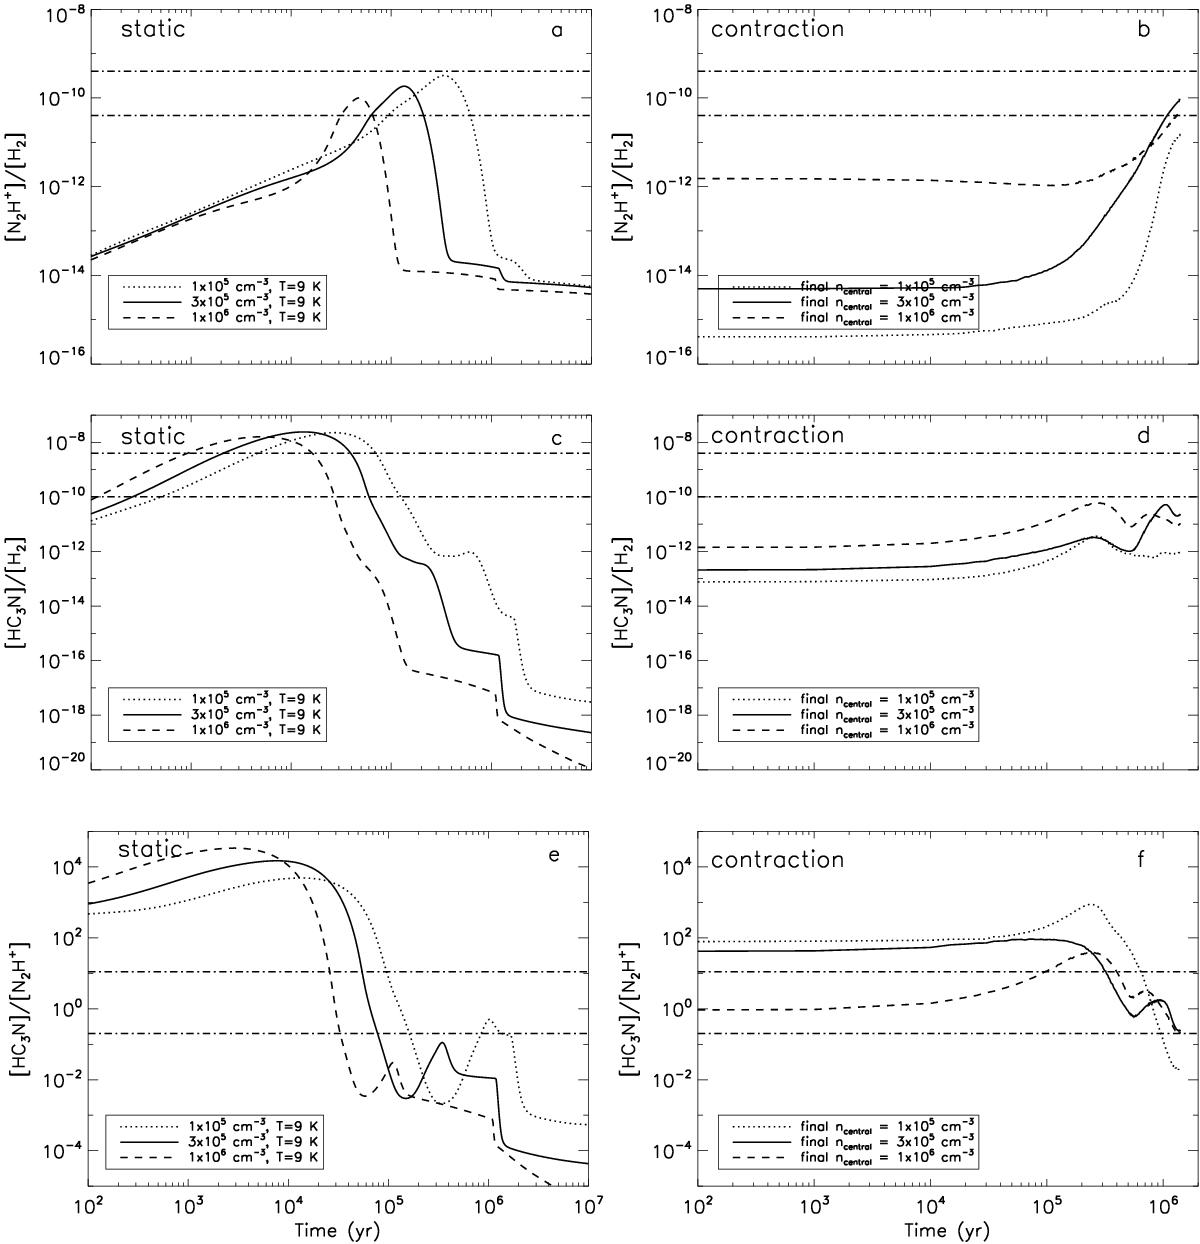
Evolution of the N2H+a), b) and HC3N c), d) abundances, and the HC3N to N2H+ abundance ratio e), f) as a function of time for free-particle densities of 1 × 105 cm-3 (dotted), 3 × 105 cm-3 (solid), and 1 × 106 cm-3 (dashed line) and a kinetic temperature of 9 K. Each column shows predictions from one specific model (static, contraction). The predictions from the contraction models correspond to abundances derived from integrated (along all depth points) column densities (see Garrod et al. 2006a,b). The horizontal dot-dashed lines indicate the range of observed values for the N2H+ (top row), HC3N abundances (middle row), and the HC3N to N2H+ ratio (bottom row). The maximum H2 column densities for the contraction models are achieved at 1 Myr and they are ~4 × 1021 cm-2, ~ 1.3 × 1022 cm-2, and ~ 4 × 1022 cm-2, respectively.
Current usage metrics show cumulative count of Article Views (full-text article views including HTML views, PDF and ePub downloads, according to the available data) and Abstracts Views on Vision4Press platform.
Data correspond to usage on the plateform after 2015. The current usage metrics is available 48-96 hours after online publication and is updated daily on week days.
Initial download of the metrics may take a while.