Fig. 10
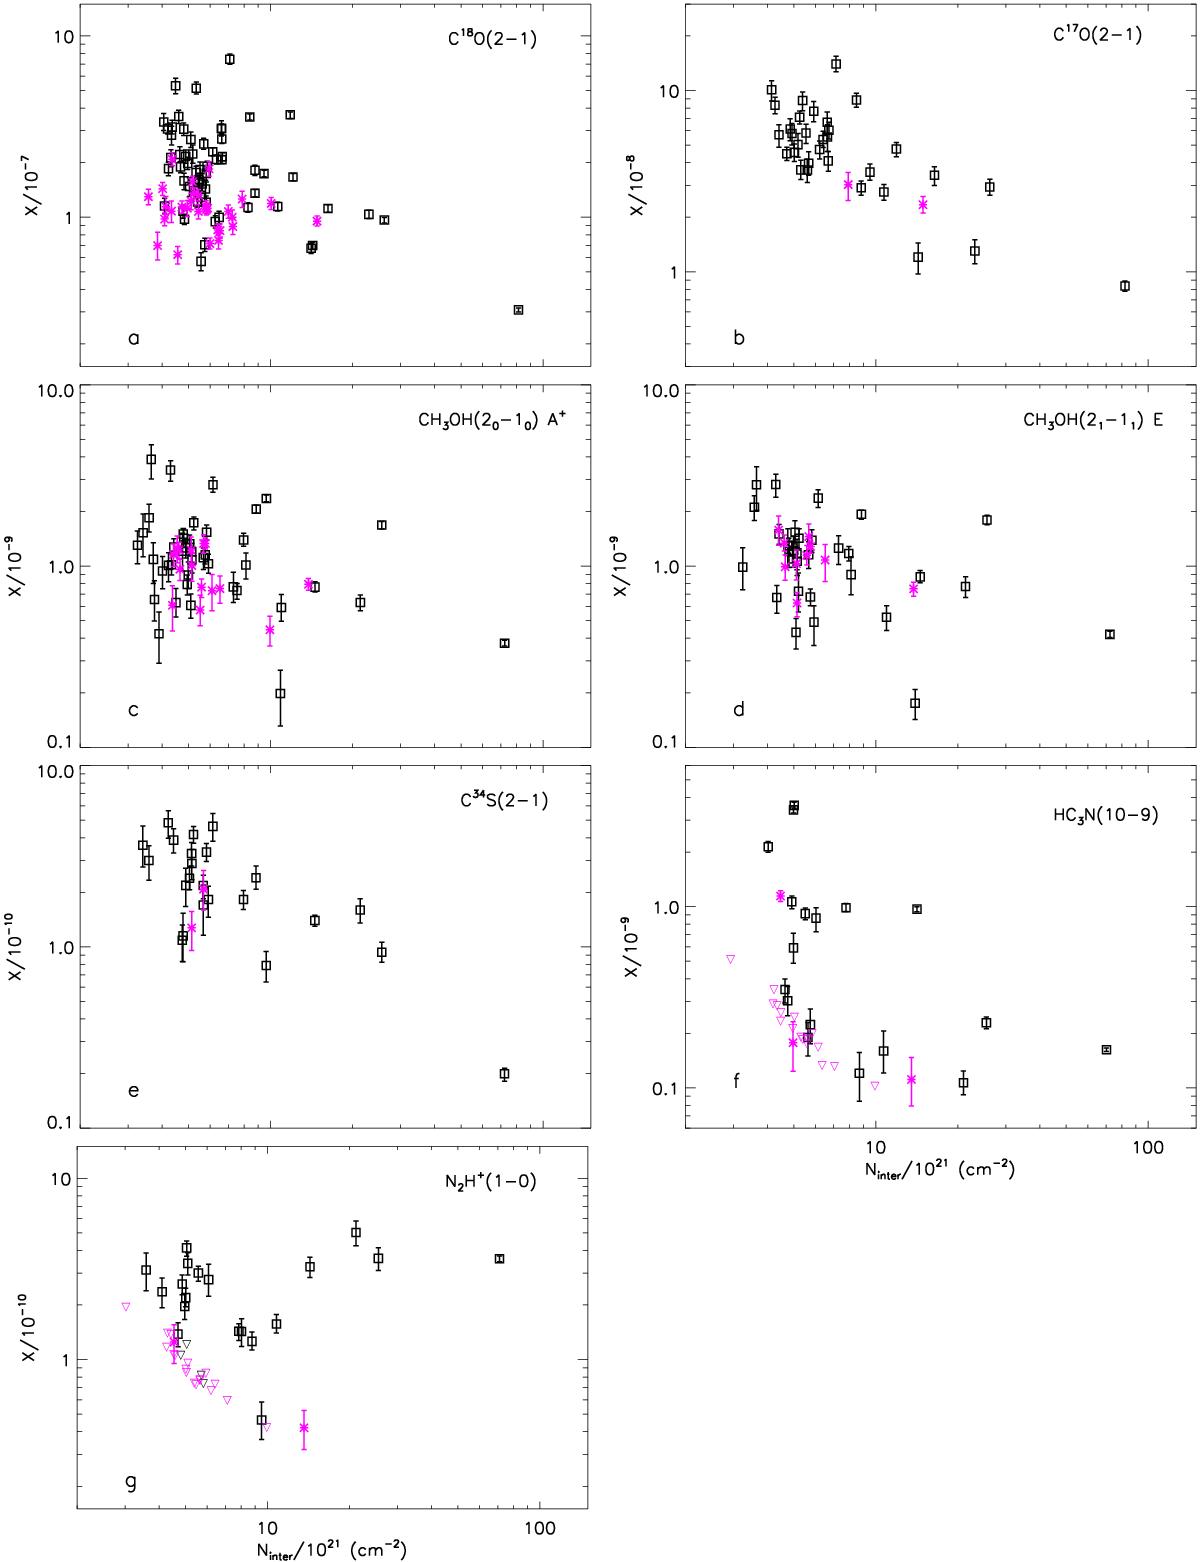
Molecular abundances relative to H2 against H2 column densities interpolated within an aperture of diameter equal to the HPBW of each transition. The abundances of the Cha I and III cores are shown as black squares and pink asterisks, respectively. Upper limits (3σ uncertainties) are shown as pink and black downward triangles for Cha III and Cha I, respectively. The N2H+ abundance of the four densest cores in panel g) was derived from the observed peak temperature of the weakest hyperfine component (11,0–01,1) while the strongest component (12,3–01,2) was used for all other cores (see Sect. 5.1).
Current usage metrics show cumulative count of Article Views (full-text article views including HTML views, PDF and ePub downloads, according to the available data) and Abstracts Views on Vision4Press platform.
Data correspond to usage on the plateform after 2015. The current usage metrics is available 48-96 hours after online publication and is updated daily on week days.
Initial download of the metrics may take a while.