Fig. 5
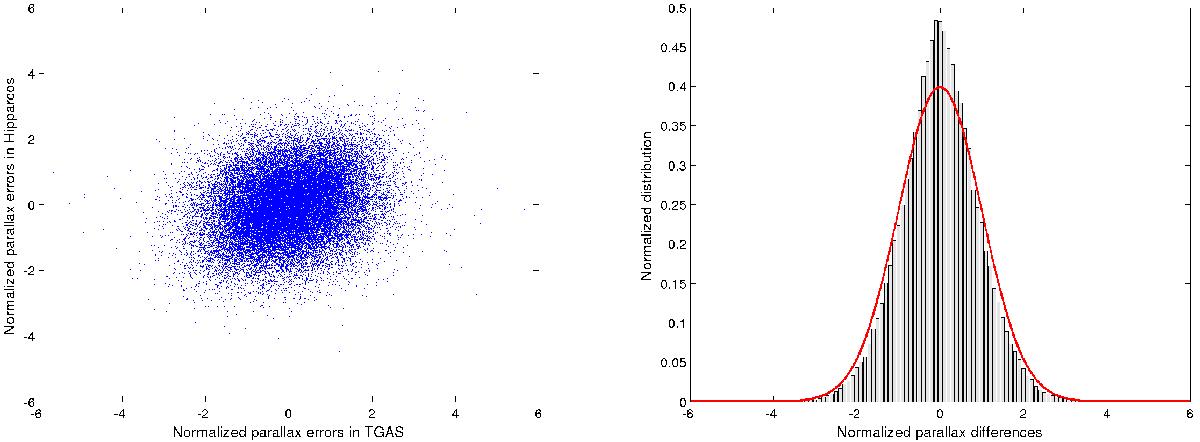
Comparison of the parallaxes in TGAS and the Hipparcos Catalogue (nominal TGAS run, i.e., using the Hipparcos parallaxes as prior). Left: the normalized parallax errors (calculated minus the simulated true values, divided by their formal standard errors) are correlated. Right: the differences of the actual parallax values (normalized by their combined standard errors) follow a Gaussian distribution with standard deviation 0.91, less than 1.0 because of the correlation. The solid red line is a Gaussian distribution with unit width.
Current usage metrics show cumulative count of Article Views (full-text article views including HTML views, PDF and ePub downloads, according to the available data) and Abstracts Views on Vision4Press platform.
Data correspond to usage on the plateform after 2015. The current usage metrics is available 48-96 hours after online publication and is updated daily on week days.
Initial download of the metrics may take a while.