Fig. 2
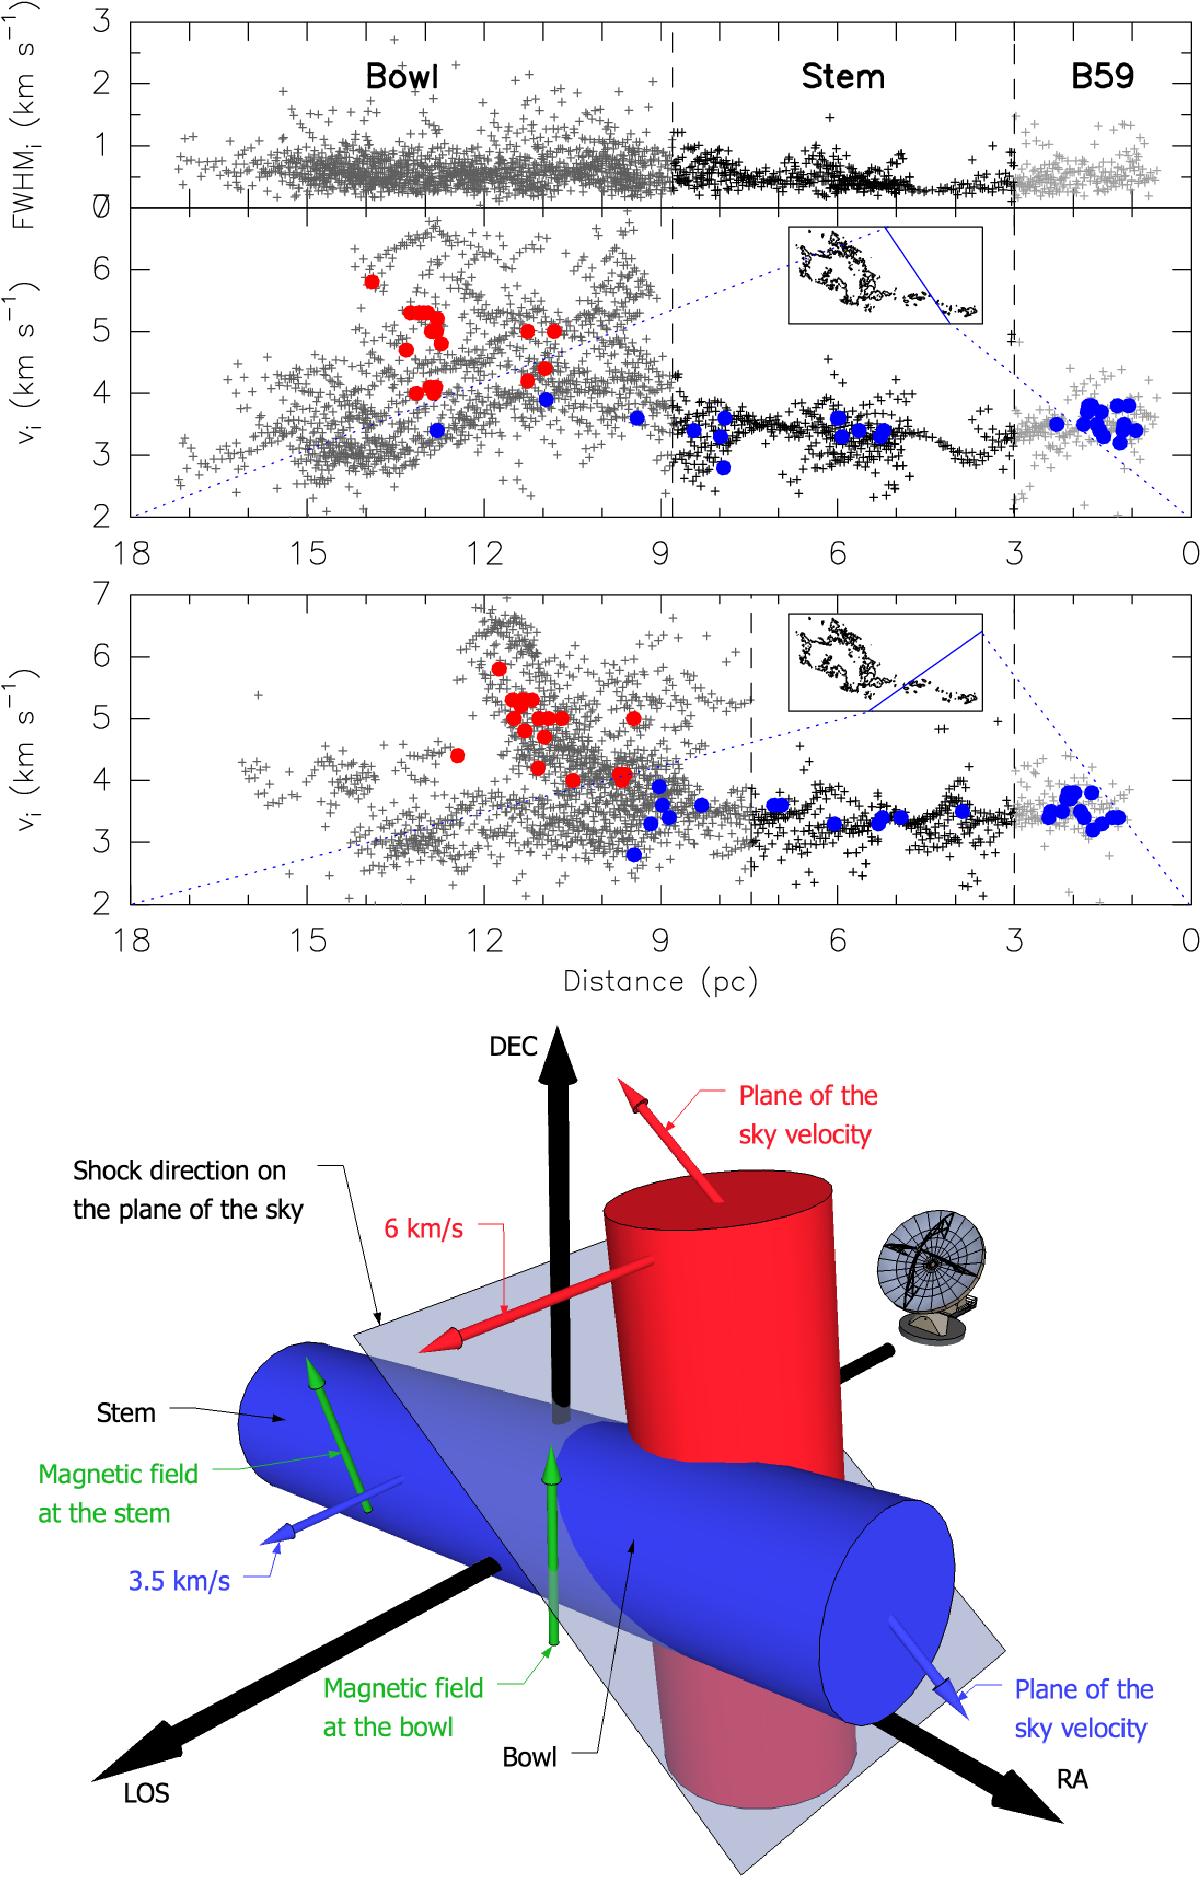
Top panels: projections of the position-position-velocity cube in two perpendicular position-velocity planes. The orientation of the projection planes is indicated as blue lines in the Av map subpanels. Bottom panel: velocity as a function of position. The projection plane is at an angle of 124° (shock direction: projection on the plane of the sky of the velocity difference of the filaments). Top panels: vi and FWHMi as a function of position. The projection plane is at an angle of 34° (perpendicular to the shock direction). Circles: dense cores as in Fig. 1. Cartoon: proposed scenario. The antenna represents the observer. Blue and red cylinders represent the E–W and N–S filaments, respectively. The LOS velocities of the filaments are shown as arrows, and the stem and bowl regions are labeled. The translucent plane shows the shock direction on the plane of the sky extended along the line-of-sight direction (blue line in bottom panel above). The velocities of the filaments along the shock are shown as arrows. Green arrows represent the tentative direction of the magnetic field (Sect. 4.3). An associated movie is available online.
Current usage metrics show cumulative count of Article Views (full-text article views including HTML views, PDF and ePub downloads, according to the available data) and Abstracts Views on Vision4Press platform.
Data correspond to usage on the plateform after 2015. The current usage metrics is available 48-96 hours after online publication and is updated daily on week days.
Initial download of the metrics may take a while.