Fig. 1
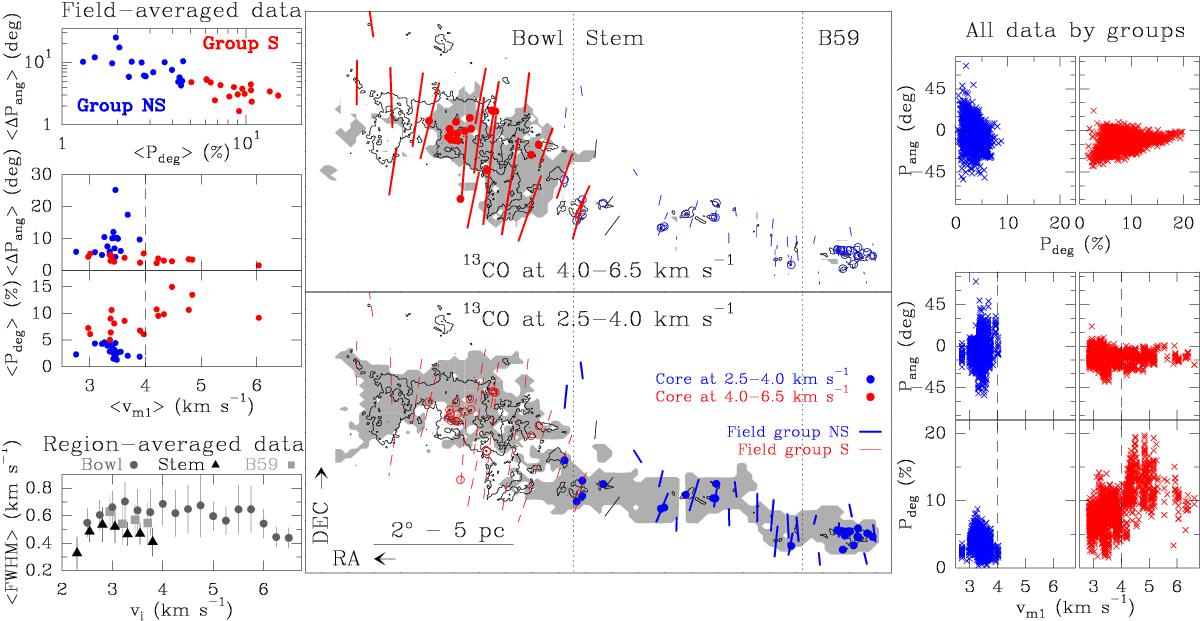
Velocity and polarization distribution of the Pipe nebula. Color code: blue and red for field groups NS and S, respectively. Central maps: Grayscale maps: top and bottom panels show the regions with 13CO vm1 in the >4 km s-1 and <4 km s-1, respectively (fitted to the map by Onishi et al. 1999). The N–S filament is evident in 12CO emission (Onishi et al. 1999). Contours: visual extinction map (Lombardi et al. 2006). Levels are 5.5 and 20 mag. Segments: average polarization segment on each observed field (AFG08; Franco et al. 2010). Length is proportional to ⟨ Pdeg ⟩. Circles: positions of the embedded dense cores with extinction peaks > 10 mag (Román-Zúñiga et al. 2009, 2010). Lefthand side panels: data averaged over the fields observed by AFG08. Top panel: ⟨ ΔPang ⟩ versus ⟨ Pdeg ⟩ as in AFG08. Central panels: ⟨ ΔPang ⟩ and ⟨ Pdeg ⟩ versus ⟨ vm1 ⟩, where m1 stands for the first-order moment of the 13CO emission. Bottom panel: average linewidth of the 13CO velocity components as a function of vi for the different cloud regions. vi is sampled in 0.25 km s-1–wide bins. Error bars indicate 1σ dispersion. Righthand side panels: data for every pixel separated by groups. Top panel: Pang versus Pdeg. Bottom panels: Pang and Pdeg versus vm1.
Current usage metrics show cumulative count of Article Views (full-text article views including HTML views, PDF and ePub downloads, according to the available data) and Abstracts Views on Vision4Press platform.
Data correspond to usage on the plateform after 2015. The current usage metrics is available 48-96 hours after online publication and is updated daily on week days.
Initial download of the metrics may take a while.