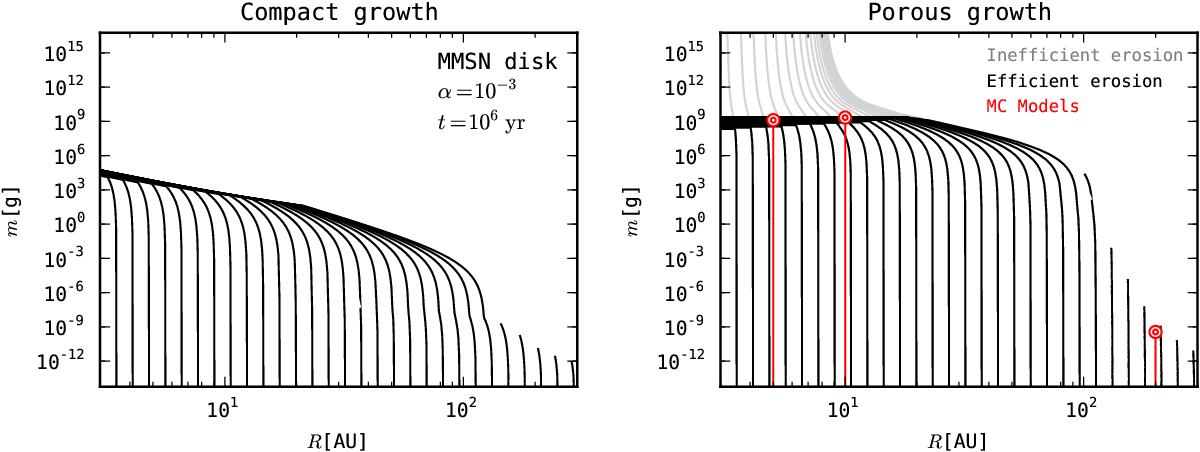
Fig. 13

Evolution of mp(t) and R(t) for dust coagulation as obtained from the semi-analytical model (Eqs. (35) and (36)), for an MMSN disk and α = 10-3. Lines indicate different starting conditions R(t = 0), and are evolved for 106 yrs. Left: compact growth: φ = 1 at all times, and vfrag = 10 m s-1. Right: porous growth: the internal structure of the aggregates is set by hit and stick growth, followed by collisional compaction or gas and self-gravity compaction. Gray lines have no erosion, while black lines show the results for veros = 40 m s-1. Colored lines and ⊚-symbols indicate the evolution and steady state peak mass obtained through local MC simulations (Sect. 4.2).
Current usage metrics show cumulative count of Article Views (full-text article views including HTML views, PDF and ePub downloads, according to the available data) and Abstracts Views on Vision4Press platform.
Data correspond to usage on the plateform after 2015. The current usage metrics is available 48-96 hours after online publication and is updated daily on week days.
Initial download of the metrics may take a while.


