Fig. 10
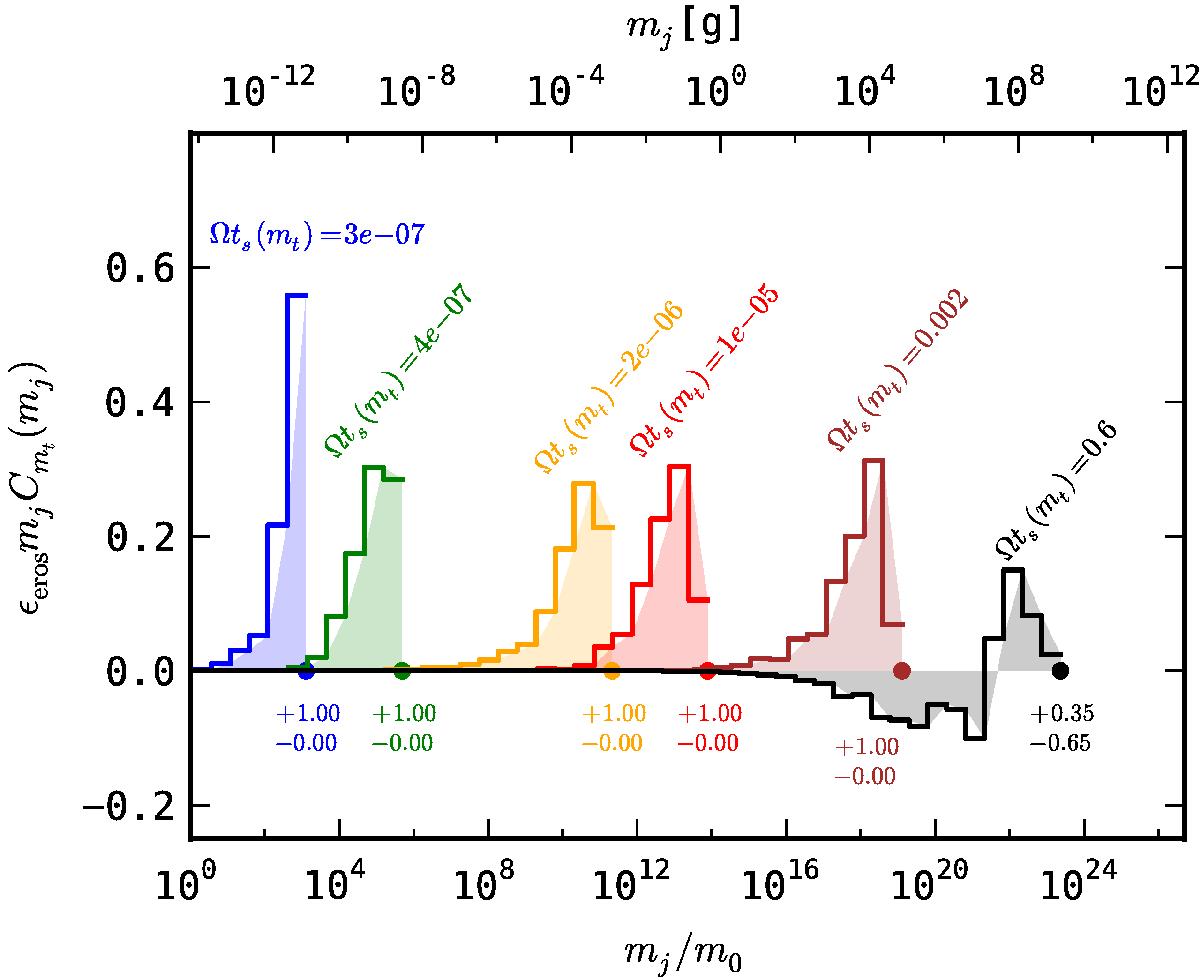
Projectile distribution mass functions for simulation E1, constructed for the maximum masses (mt =•) at various times. Colors and times correspond to Fig. 9. For each distribution, the stopping time of the mt-particle is given, and the weights of the total positive and negative area are plotted. The distributions have been normalized in such a way, that the absolute sum of the contributions equals 1.
Current usage metrics show cumulative count of Article Views (full-text article views including HTML views, PDF and ePub downloads, according to the available data) and Abstracts Views on Vision4Press platform.
Data correspond to usage on the plateform after 2015. The current usage metrics is available 48-96 hours after online publication and is updated daily on week days.
Initial download of the metrics may take a while.